
- GBP/USD steps back from monthly high, pressured around intraday low of late.
- Bearish candlestick, chart pattern joins downbeat MACD signals to keep sellers hopeful.
- Bulls may aim for late November swing high on breaking wedge’s resistance.
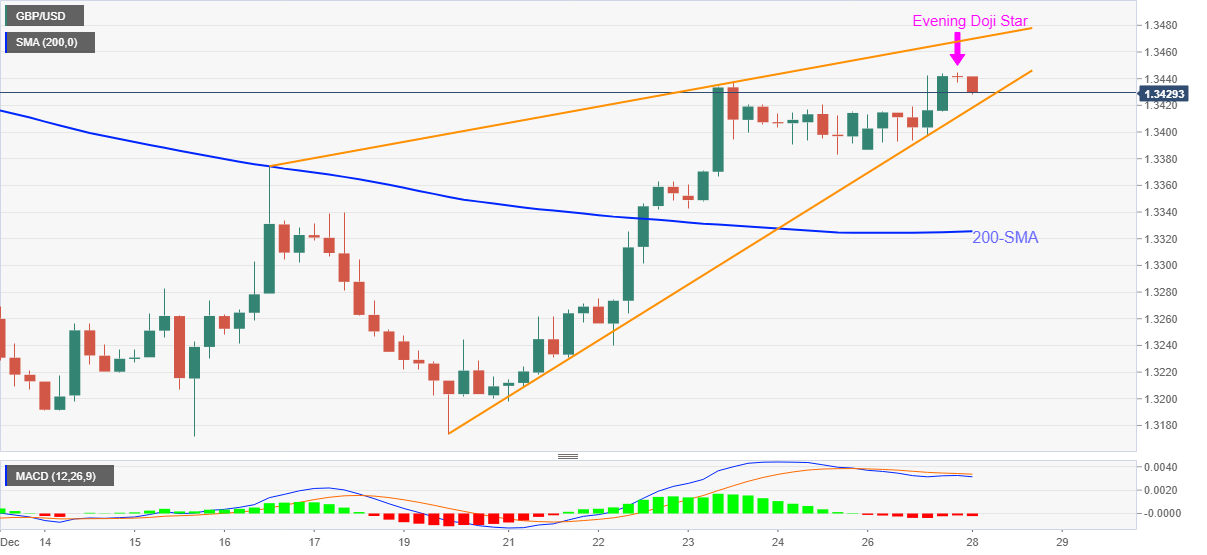
GBP/USD justifies the bearish candlestick formation on the four-hour chart while taking offers around 1.3430, down 0.10% on a day heading into Tuesday’s London open.
The cable pair refreshed the five-week top the previous day before easing from 1.3448. In doing so, the quote portrayed Evening Doji star bearish candlestick formation while also forming the rising wedge pattern near the multi-day top.
Considering the bearish MACD signals favoring the downbeat hints from candlestick and chart pattern, GBP/USD is likely to witness further downside.
However, a clear break of 1.3415 will be clear for the quote’s theoretical south-run targeting the yearly low near 1.3170. During the fall, the 200-SMA level around 1.3325 can act as a buffer.
Alternatively, corrective pullback not only needs to refresh the intraday high past 1.3445 but should also cross the upper line of the stated wedge, near .3470, to reject the bearish calls.
In that case, GBP/USD bulls will aim for the highs marked during November 18 and 09, respectively around 1.3515 and 1.3610.
GBP/USD: Four-hour chart
Trend: Further weakness expected


