
- GBP/USD holds lower ground near the support line of weekly triangle.
- Bearish MACD signals, sustained trading below the key HMAs favor sellers.
- Ascending support line from July 21 appears short-term important support.
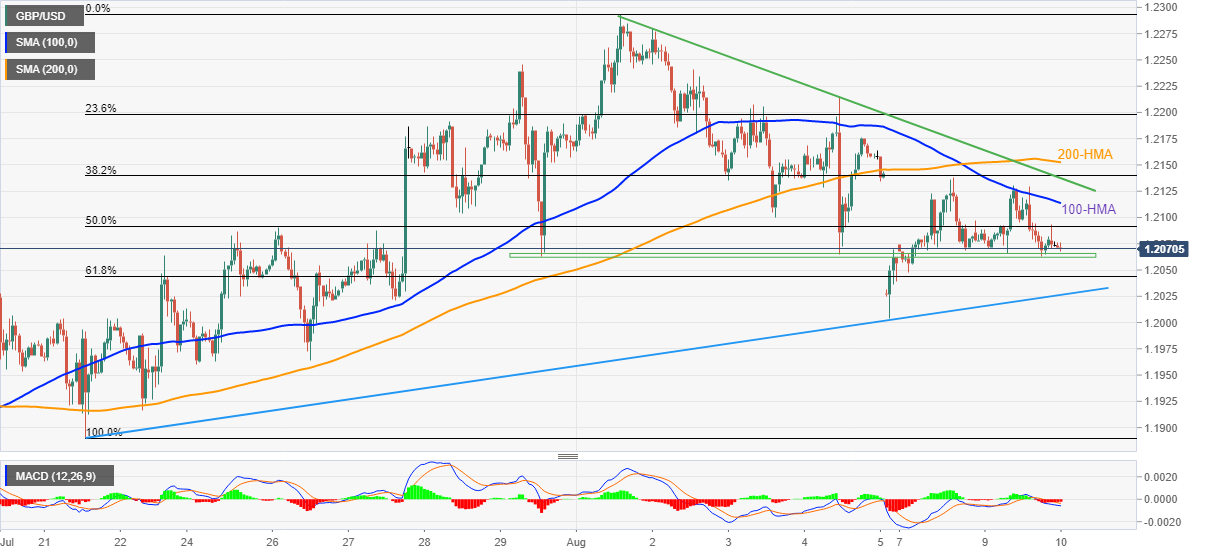
GBP/USD remains pressured around the intraday low near 1.2070 during Wednesday’s Asian session.
The downside bias remains favored by the pair’s sustained trading below the 200-HMA and the 100-HMA, as well as the bearish MACD signals. However, the support line of the one-week-old descending triangle appears to challenge the GBP/USD bears of late.
Hence, the quote’s further weakness depends upon how well the Cable pair breaks the 1.2060 support. Also acting as the downside filter is the 61.8% Fibonacci retracement (Fibo.) level of July 21 to August 01 up-moves, near 1.2045.
It’s worth noting that the three-week-long ascending trend line, close to 1.2025 at the latest, acts as the last defense of the GBP/USD buyers.
Alternatively, the 50% Fibonacci retracement level and the 100-HMA, near 1.2090 and 1.2115 in that order, restrict the short-term recovery of the pair.
Following that, the 200-HMA level surrounding 1.2155 could test the bulls before directing them to the monthly high near 1.2295 and the 1.2300 threshold.
Overall, GBP/USD is likely to remain weak but the quote is near the short-term important support levels.
GBP/USD: Hourly chart
Trend: Further weakness expected


