
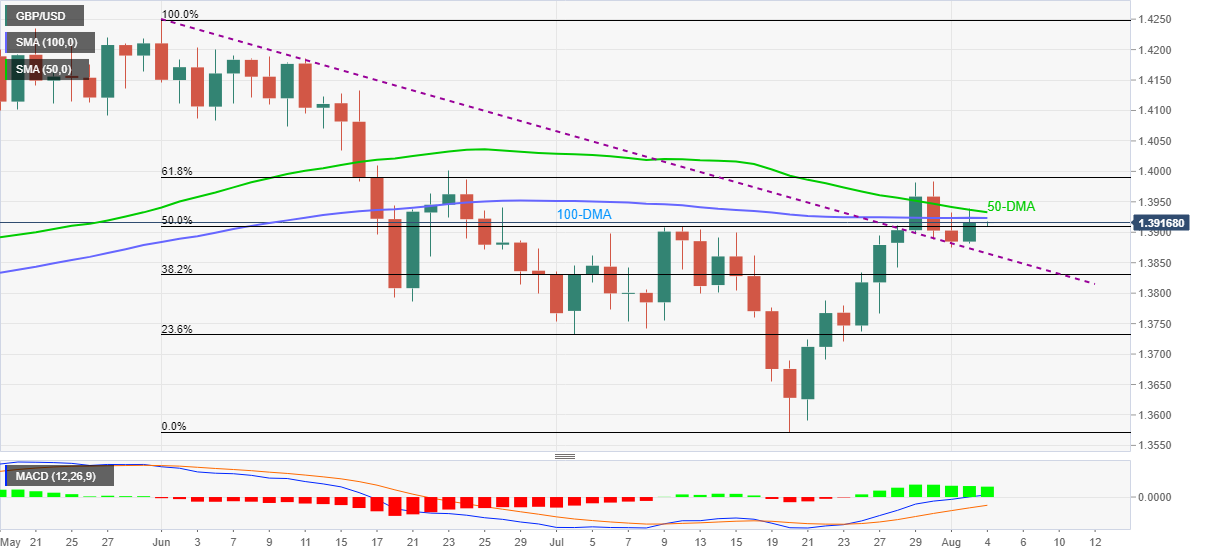
- GBP/USD struggles to extend recovery moves from previous resistance line.
- 100-DMA guards immediate upside, 50-DMA and 61.8% Fibonacci retracement follow the line.
- Bullish MACD, sustained break of the key resistance line favor buyers.
GBP/USD seesaws around 1.3920-15 amid the initial Asian session on Wednesday. In doing so, the cable takes rounds to 50.0% Fibonacci retracement (Fibo.) of June–July downturn while keeping the previous day’s rebound from the resistance-turned-support line from June 01.
Given the bullish MACD and the pair’s ability to stay firmer past the earlier resistance line, GBP/USD may overcome the immediate hurdle, namely 100-DMA level of 1.3925 and 50-DMA close to 1.3935.
However, the pair’s further upside will be challenged by July’s top of 1.3983, 61.8% Fibo. near 1.3990 and mid-June top near 1.4010.
Meanwhile, the stated falling trend line, around 1.3865, restricts short-term GBP/USD downside ahead of June’s low near 1.3785.
If at all GBP/USD bears keep reins past 1.3785, 23.6% Fibo. surrounding 1.3730 and 1.3690 support level could challenge the fall towards the last month’s low of 1.3572.
GBP/USD: Daily chart
Trend: Pullback expected


