
- GBP/USD wobbles near late February tops after the heaviest run-up in three weeks.
- Immediate hurdle, RSI conditions suggest pullback towards previous key resistance.
- Multiple confluences will offer a bumpy ride to the bears, bulls aim for yearly top.
GBP/USD bulls catch a breather around 1.4125, up 0.05% intraday, amid Tuesday’s Asian session. The cable jumped to the highest in 10 weeks the previous day, not to forget posting the biggest daily gain since April 19.
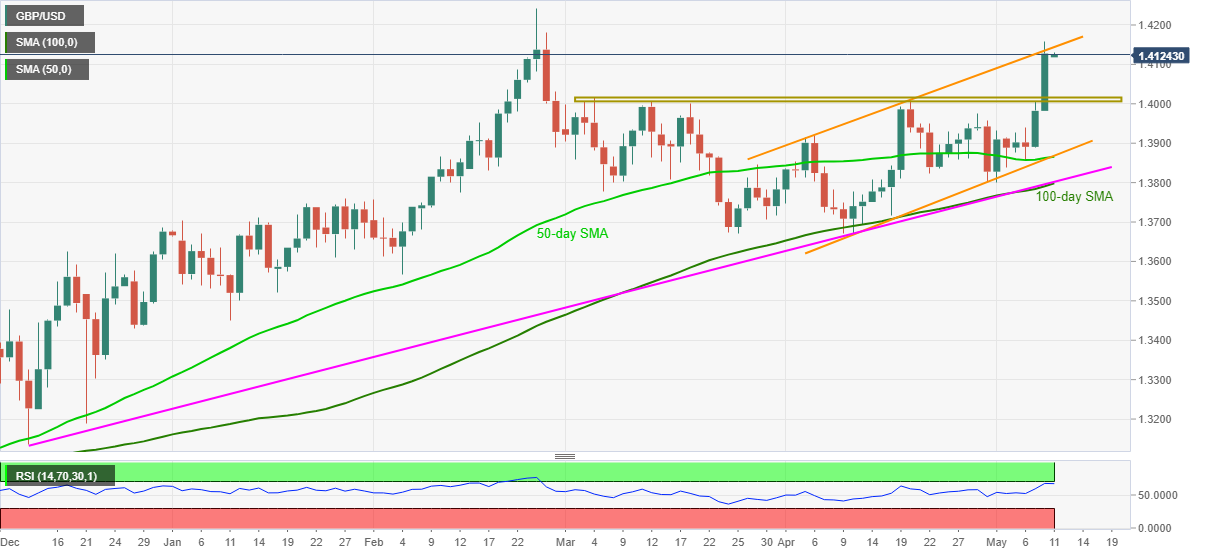
However, the heavy run-up propelled the RSI line close to the overbought region as the prices test the upper line of the one-month-old rising trend channel. Though, the quote remains well beyond the 1.4010-20 previous resistance area, crossed on Monday.
Hence, GBP/USD may witness short-term pullback towards revisiting the 1.4020-10 area but any further downside becomes doubtful.
If at all the bears dominate below 1.4010, they need to conquer the 1.4000 psychological magnet before challenging the 1.3865-60 support confluence including 50-day SMA and lower line of the stated channel. It’s worth mentioning that 100-day SMA and a rising trend line from December 11, 2020, add to the downside filter around the 1.3800 threshold.
Meanwhile, a clear upside past-1.4145 becomes necessary for the GBP/USD bulls to challenge the yearly top surrounding 1.4245. During the rally, the 1.4200 round figure could act as an intermediate halt.
GBP/USD daily chart
Trend: Pullback expected


