
- GBP/USD holds on to corrective bounce off weekly low.
- Bullish candlestick above 200-DMA favors further consolidation of previous losses.
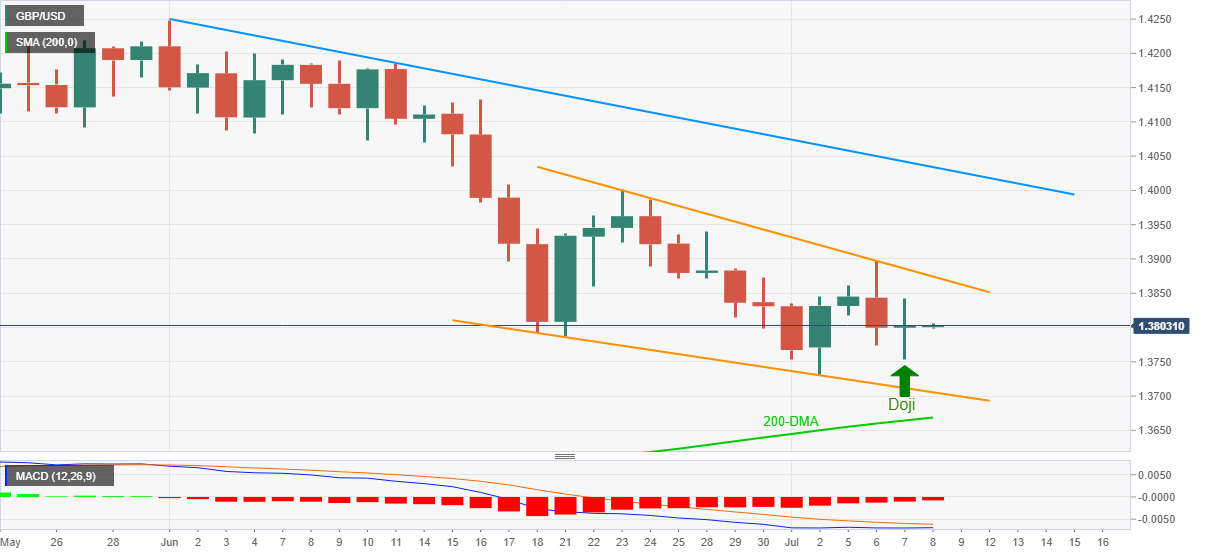
- Falling wedge confirmation could bolster the recovery moves.
GBP/USD remains sidelined near 1.3800 amid Thursday’s Asian session, following a volatile day that marked a candlestick suggesting trend-reversal.
The odds of the pair’s up-moves also benefit from the moves beyond 200-DMA, as well as inside the falling wedge bullish chart pattern. Additionally, the receding bearish bias of the MACD also keeps the cable buyers hopeful.
It should, however, be noted that the upper line of a three-week-old falling wedge, near 1.3875 will initially test the anticipated recovery, a break of which could propel GBP/USD bulls to the 1.4000 psychological magnet.
Though, a five-week-old falling trend line near 1.4035 could challenge the pair’s further upside.
Meanwhile, pullback moves may aim for the latest trough surrounding 1.3730 ahead of highlighting the support line of the wedge, close to the 1.3700 round figure.
It’s worth observing that the GBP/USD sellers will have to conquer the 200-DMA level of 1.3668 to dominate further even if they manage to defy the bullish chart formation by breaking the 1.3700 support.
GBP/USD: Daily chart
Trend: Recovery expected


