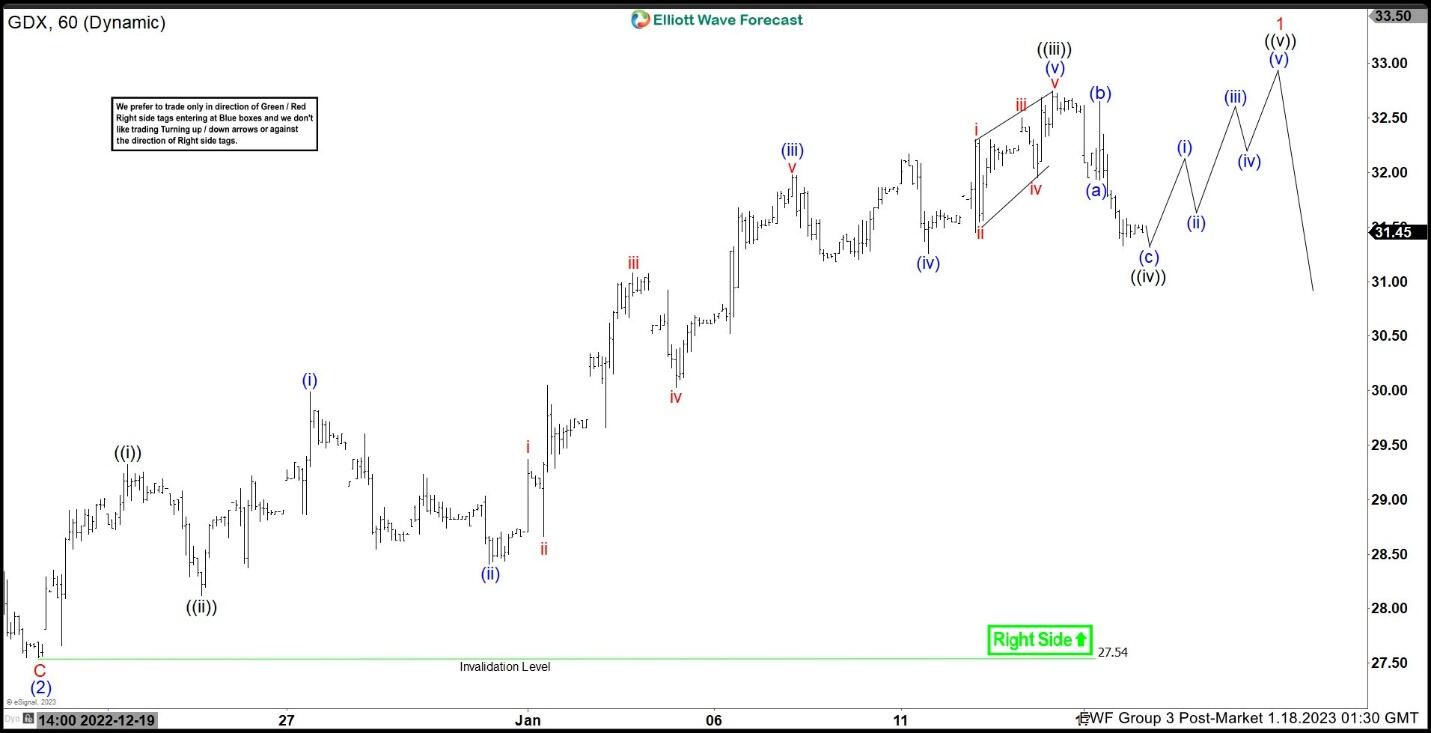
1 hour chart of Gold Miners ETF (GDX) below shows that the pullback to 27.54 ended wave (2). The ETF has since extended higher in wave (3). Internal subdivision of wave (3) is in a 5 waves impulsive Elliott Wave structure. Up from wave (2), wave ((i)) ended at 29.32 and pullback in wave ((ii)) ended at 28.12. Then the ETF rallied higher in a nest. Up from wave ((ii)), wave (i) ended at 29.99 and dips in wave (ii) ended at 28.41. Wave (iii) ended at 31.98 and pullback in wave (iv) ended at 31.26. Final leg wave (v) ended at 32.75 which completed wave ((iii)).
Pullback in wave ((iv)) is ongoing as a zigzag where wave (a) ended at 31.94 and rally in wave (b) ended at 32.65. Wave (c) lower is expected to end soon which also complete wave ((iv)). Afterwards, the ETF should rally higher in wave ((v)) before ending wave 1 and cycle from 12.20.2022 low. GDX should then pullback in wave 2 to correct the cycle from 12.20.2022 low in larger degree before the rally resumes. As far as pivot at 12.20.2022 low (27.54) remains intact, expect pullback to find support in 3, 7, or 11 swing for more upside.
GDX 60 Minutes Elliott Wave Chart