- Gold Price continues to trade above key support level.
- 10-year US T-bond yield edges lower following Monday's upsurge.
- Sellers could take action if XAUUSD breaks below $1,840.
Gold Price registered daily losses on Monday but managed to erase a portion of its losses on Tuesday. The recent price action, however, doesn't point to a buildup of bullish momentum. Nevertheless, the significant technical support that aligns at $1,840 stays intact for the time being, causing sellers to remain on the sidelines.
US T-bond yields retreat
Following the previous week's rally, the benchmark 10-year US Treasury bond yield pushed push higher on Monday and broke above the key 3% level. In the absence of high-impact macroeconomic data releases, the upbeat US jobs report allowed yields to continue to rise. According to the CME Group FedWatch Tool, the probability of the Fed hiking its policy rate by a total of 125 basis points in the next two meetings rose to 15% from 4% last week. With safe-haven flows dominating the financial markets on Tuesday, yields edge lower and help XAUUSD stage a recovery.
Also read: Gold Price Forecast: Bearish technical structure suggests more pain ahead.
Gold Price ignores US data
The data published by the US Census Bureau revealed on Tuesday that the goods and services deficit of the United States narrowed by $20.6 billion to $87.1 billion in April. During that period, exports rose by $8.5 billion to $252.6 billion, while imports declined by $12.1 billion to $339.7 billion. These figures triggered little to no market reaction and gold continued to fluctuate in its daily range.
Earlier in the day, the monthly report published by the People's Bank of China (PBOC) showed that China's gold reserves remained steady at 62.64 million fine troy ounces at the end of May. The value of China's gold reserves, however, declined to $115.18 billion at the end of May from $119.73 billion at the end of April. Last week, Bloomberg reported that India's gold reserves increased by 9.4% on a yearly basis to 760.4 in the year ended March.

Gold bars
Meanwhile, investors gear up for this week's key events and data releases. The European Central Bank will announce its policy decision on Thursday and the US Bureau of Labor Statistics will publish the Consumer Price Index (CPI) data on Friday. Although the US Federal Reserve uses the Personal Consumption Expenditures (PCE) Price Index as its preferred gauge of inflation, the CPI reading is likely to trigger a significant market reaction. Analysts expect the CPI to tick down to 8.2% in May from 8.3% in April. A stronger-than-forecast print should provide a boost to yields and weigh on XAUUSD and vice versa.
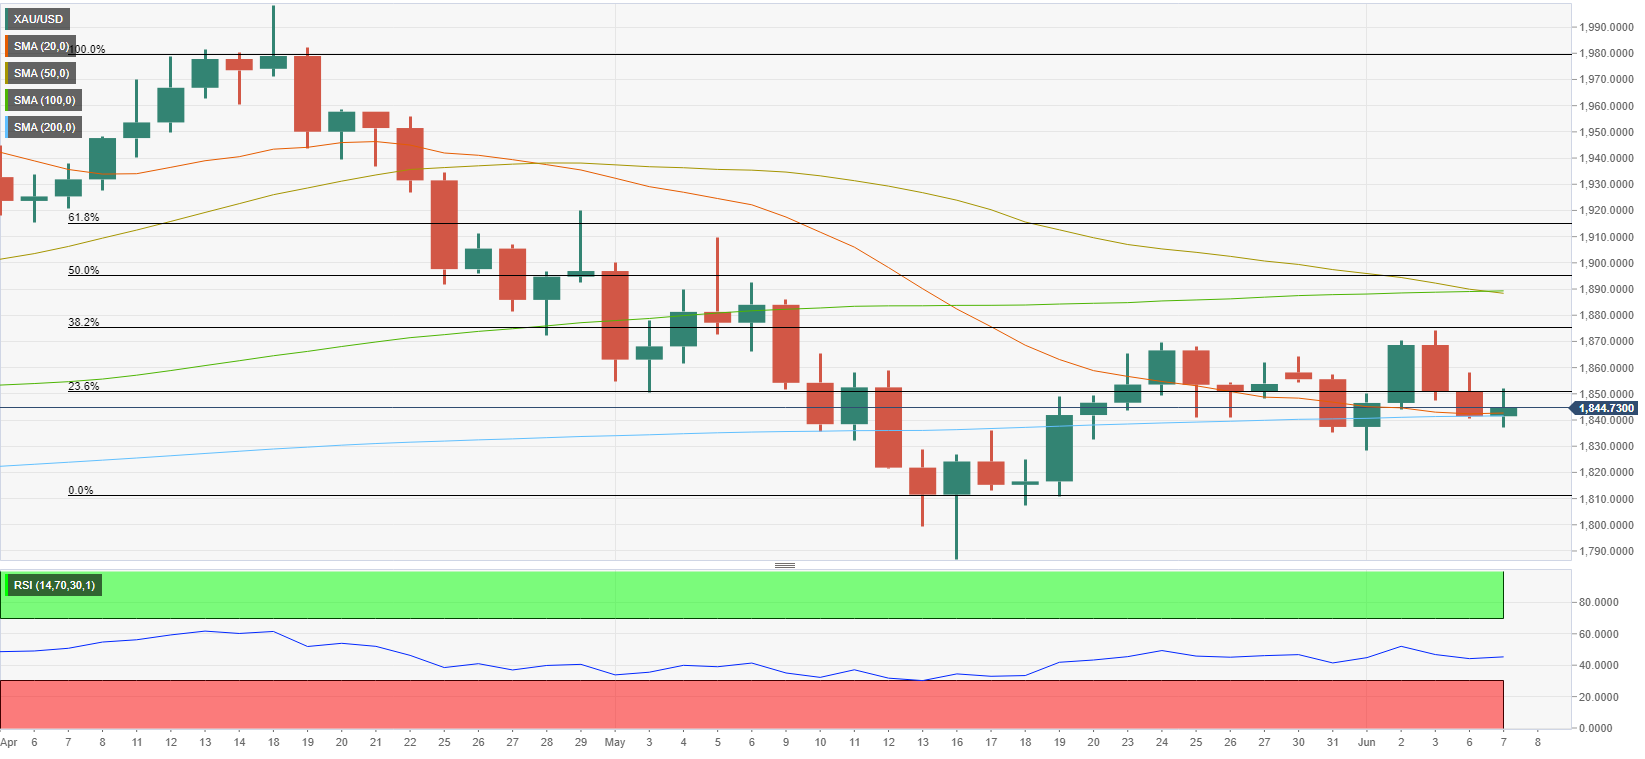
Gold Price technical outlook
Gold Price continues to trade above the 200-day SMA, which is currently located at $1,840. When gold made a daily close below that level on May 31, it managed to reclaim it the next day. Hence, sellers might want to wait for a confirmation that $1,840 turned into resistance before taking action. In that scenario, $1,830 (static level) aligns as interim support ahead of $1,810 (the end-point of the latest downtrend) and $1,800 (psychological level).
On the other hand, $1,850 (Fibonacci 23.6% retracement) forms initial resistance. A daily close above that level could be seen as a bullish development and open the door for an extended rebound toward $1,874 (Fibonacci 38.2% retracement) and $1,890 (50-day SMA, 100-day SMA).