
- Gold price fades upside momentum during the first positive week in three, grinds higher of late.
- Pre-data anxiety, mixed sentiment test XAU/USD buyers, firmer yields also restricts upside momentum.
- Strong inflation numbers could pare gold’s weekly gains amid hawkish central banks, recession woes.
Gold price (XAU/USD) remains sidelined around the weekly tops, taking rounds to $1,660 during early Friday morning in Europe, as traders await the key data from the Fed’s preferred inflation gauge. Also challenging the metal prices could be the mixed sentiment and risk catalysts, as well as the quarter-end positioning.
That said, the recently printed mixed activity data from China, one of the major gold consumers, act as the immediate catalyst to limit the XAU/USD moves. That said, China’s official NBS Manufacturing PMI rose to 50.1 versus 49.6 expected and 49.4 prior while the Non-Manufacturing PMI declined to 50.6 compared to 52.0 market forecasts and 52.6 prior readings. Further, China's Caixin Manufacturing PMI dropped to 48.1 during the stated month versus 49.5 expected and prior.
On the other hand, news that the dragon nation eased FX restrictions in response to the Fed rate rise, shared by the Financial Times (FT), contrasts the fears of a recession in Beijing to challenge momentum traders.
Elsewhere, hawkish central bankers and fears of recession underpin the Treasury yields but the US dollar struggles to regain upside momentum amid the quarter-end positioning. That said, the US Dollar Index (DXY) remains mildly bid around 112.10 while bracing for the first weekly loss in three. It should be noted that the stock futures and the Asia-Pacific equities also trade mixed as markets await the key US and European inflation numbers.
Additionally, the geopolitical tension between Russia and Ukraine joins the Sino-American tussles and the West versus Moscow problems to challenge the XAU/USD upside. On the contrary, the recent stimulus from the UK and Japan seems to help the risk-takers.
To sum up, the gold price anxiously awaits the US and Eurozone inflation data for clear directions.
Also read: US August PCE Inflation Preview: Will it trigger a dollar correction?
Technical analysis
Gold price retreats from a 12-day-old descending resistance line, attacking the weekly triangle’s bottom near $1,660 by the press time. While the steady RSI and recently sluggish MACD hint at further grinding of the XAU/USD, the 50-SMA level around $1,652 act as an extra filter for the bear’s entry.
Following that, $1,642 and the latest swing low, also the yearly low of $1,614, could challenge the metal sellers.
It should be noted, that the commodity’s weakness past $1,614 will be challenged by the $1,600 threshold and a downward sloping support line from September 16, close to $1,605 at the latest.
Alternatively, an upside clearance of the immediate resistance line near $1,663 must cross the triangle’s upper line, at $1,671 as we write, to convince gold buyers. In that case, a run-up towards $1,688 and the $1,700 becomes imminent.
Gold: Four-hour chart
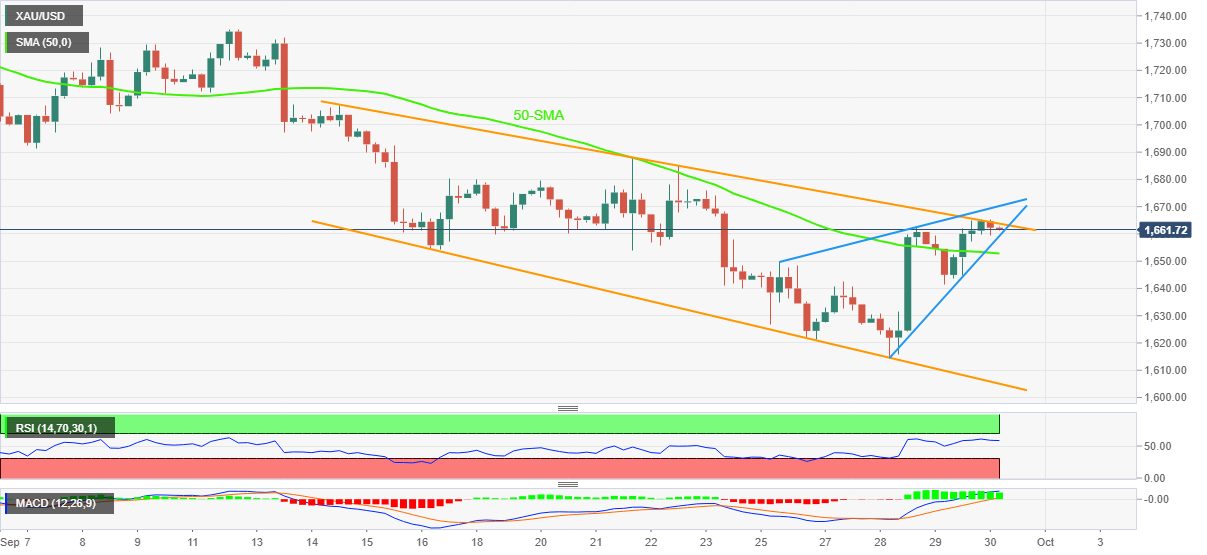
Trend: Limited upside expected


