
- Gold Price remains overwhelmed by markets’ pricing in of a 1% July Fed rate hike.
- US dollar is a clear winner, benefiting from risk-off flows and firmer yields.
- XAUUSD downside to accelerate on a break below the key $1,703 level.
Gold Price loses its shine once again, as aggressive Fed tightening bets bump up following the hotter-than-expected US inflation data. According to the CME FedWatch Tool, markets are pricing in a nearly 80% probability of a full percentage-point rise at the coming meeting. The Fed’s ‘front-loading’ commitment may not go down too well for the market, as a recession looks imminent. Against this backdrop, the US dollar is likely to remain in a win-win situation, as a flight to safety mode could boost its haven demand. Investors also remain unnerved, with the US earnings season kicking off and ahead of Friday’s release of the Fed’s most closely watched inflation gauge – the Index of Common Inflation Expectations (CIE). The Fedspeak will also grab attention, as the ‘blackout period begins from next week.
Also read: Gold Price Forecast: For how long can XAUUSD defend $1,700?
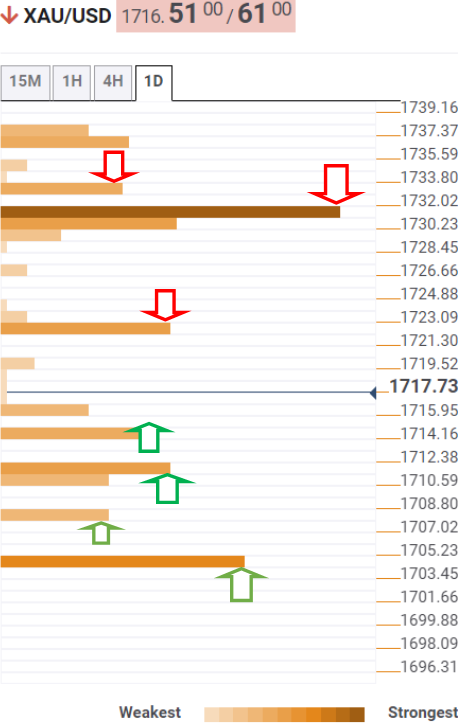
Gold Price: Key levels to watch
The Technical Confluence Detector shows that Gold Price has resumed its downward spiral, looking to take out the strong support around $1,714, which is the convergence of the pivot point one-day S1 and the previous low four-hour.
The next critical downside target is envisioned at $1,711, where the Bollinger Band one-day Lower meets with the pivot point one-week S1. Further south, the previous day’s low of $1,707 will be attacked.
Failure to resist above the latter will put the final line of defense at $1,703 under threat.
Alternatively, if the Fibonacci 61.8% one-day resistance at $1,722 holds the fort, it will pose a nightmare for XAU bulls to initiate any meaningful recovery towards a dense cluster of upside hurdles placed around $1,731.
At that level, the Fibonacci 38.2% one-day, SMA5 four-hour and the previous week’s low coincide.
The previous high four-hour at $1,737 will be back on buyers’ radars.
The next stop for bulls is seen at the Fibonacci 38.2% one-day at $1,744. The Fibonacci 23.6% one-week at $1,750 will guard the further upside, a failure of which will challenge the convergence of the pivot point one-month S2 and pivot point one-day 1 at $1,753.
Here is how it looks on the tool
About Technical Confluences Detector
The TCD (Technical Confluences Detector) is a tool to locate and point out those price levels where there is a congestion of indicators, moving averages, Fibonacci levels, Pivot Points, etc. If you are a short-term trader, you will find entry points for counter-trend strategies and hunt a few points at a time. If you are a medium-to-long-term trader, this tool will allow you to know in advance the price levels where a medium-to-long-term trend may stop and rest, where to unwind positions, or where to increase your position size.


