
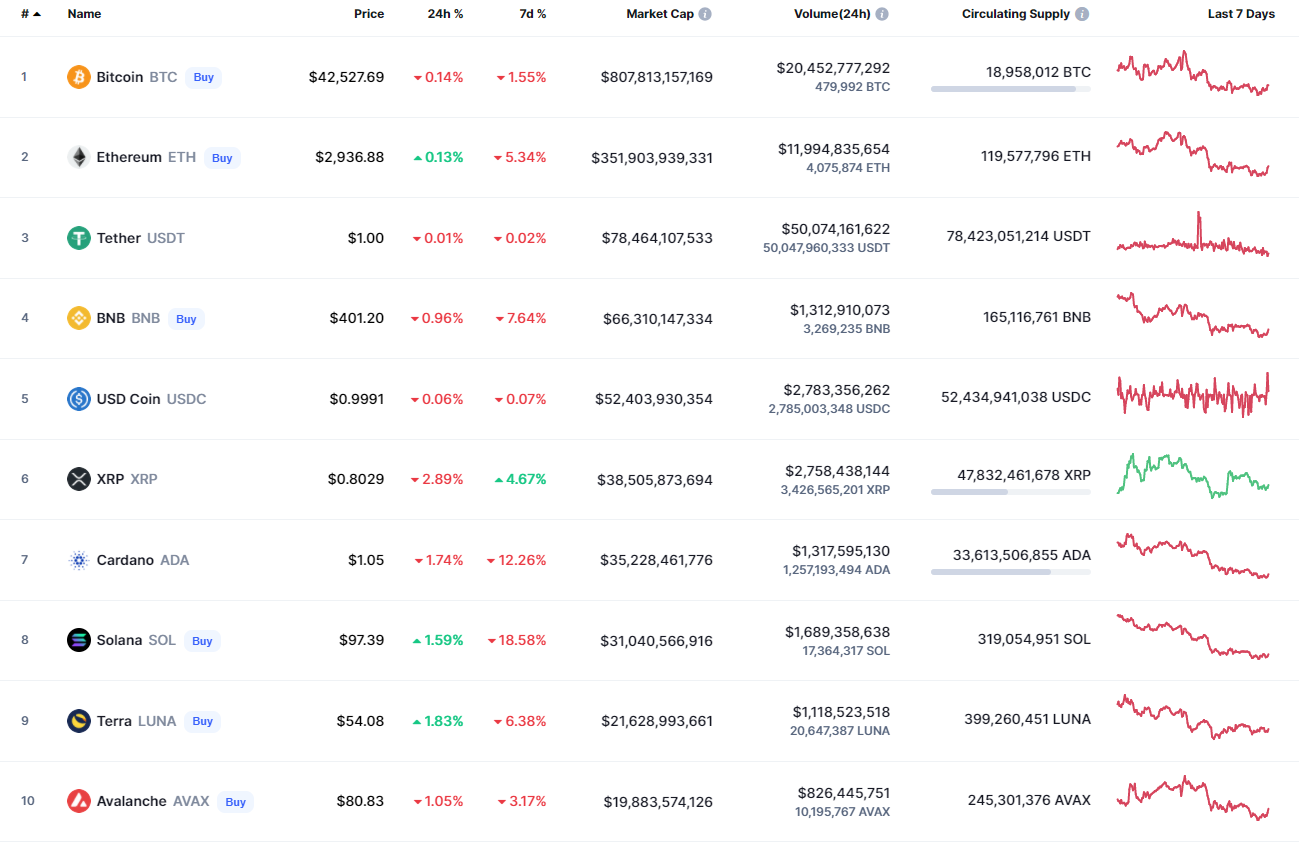
The new week has started with neutral sentiment in the market as some coins are trading in the green zone while others remain in the red.
BTC/USD chart by TradingView
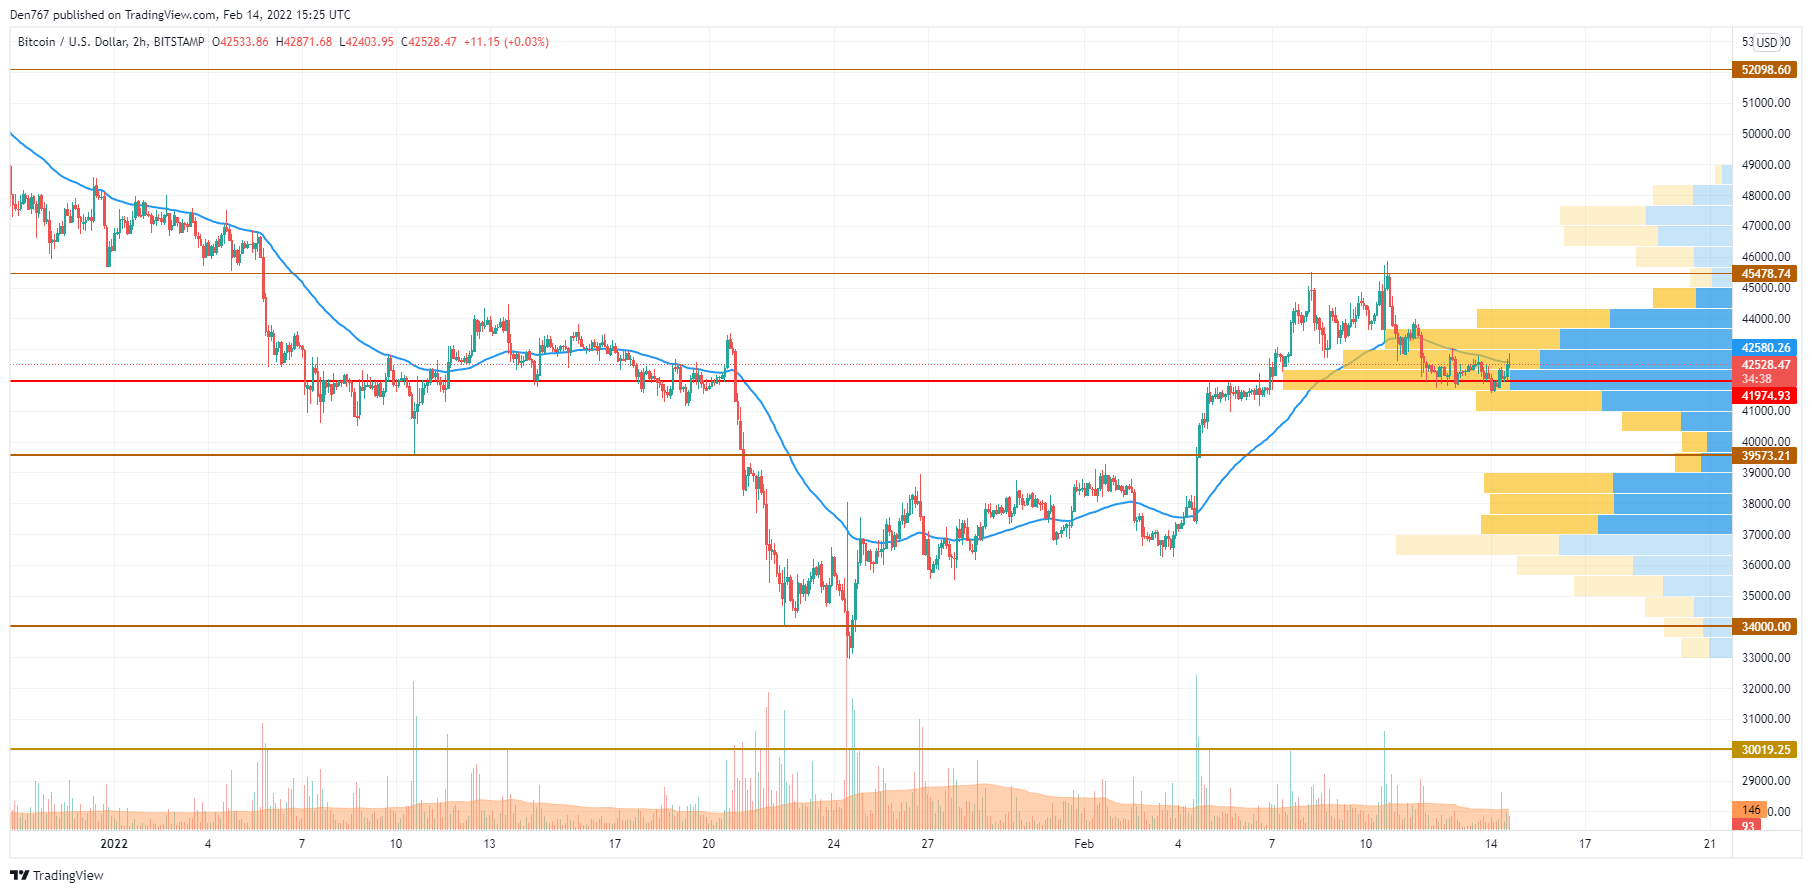
BTC/USD
Over the weekend, buyers tried to push the price of Bitcoin (BTC) back above the two-hour EMA55 but could not overcome the resistance of the average price level.
BTC/USD chart by TradingView
By the end of the week, the pair slipped back below $42,450, and the price of BTC tested the Point Of Control (POC) indicator line ($41,650).
If the POC line does not hold the price during short-term consolidation, then the decline can continue to the psychological level of $40,000. If bulls find support, then they may try to gain a foothold above the EMA55 moving average again.
Bitcoin is trading at $42,503 at press time.
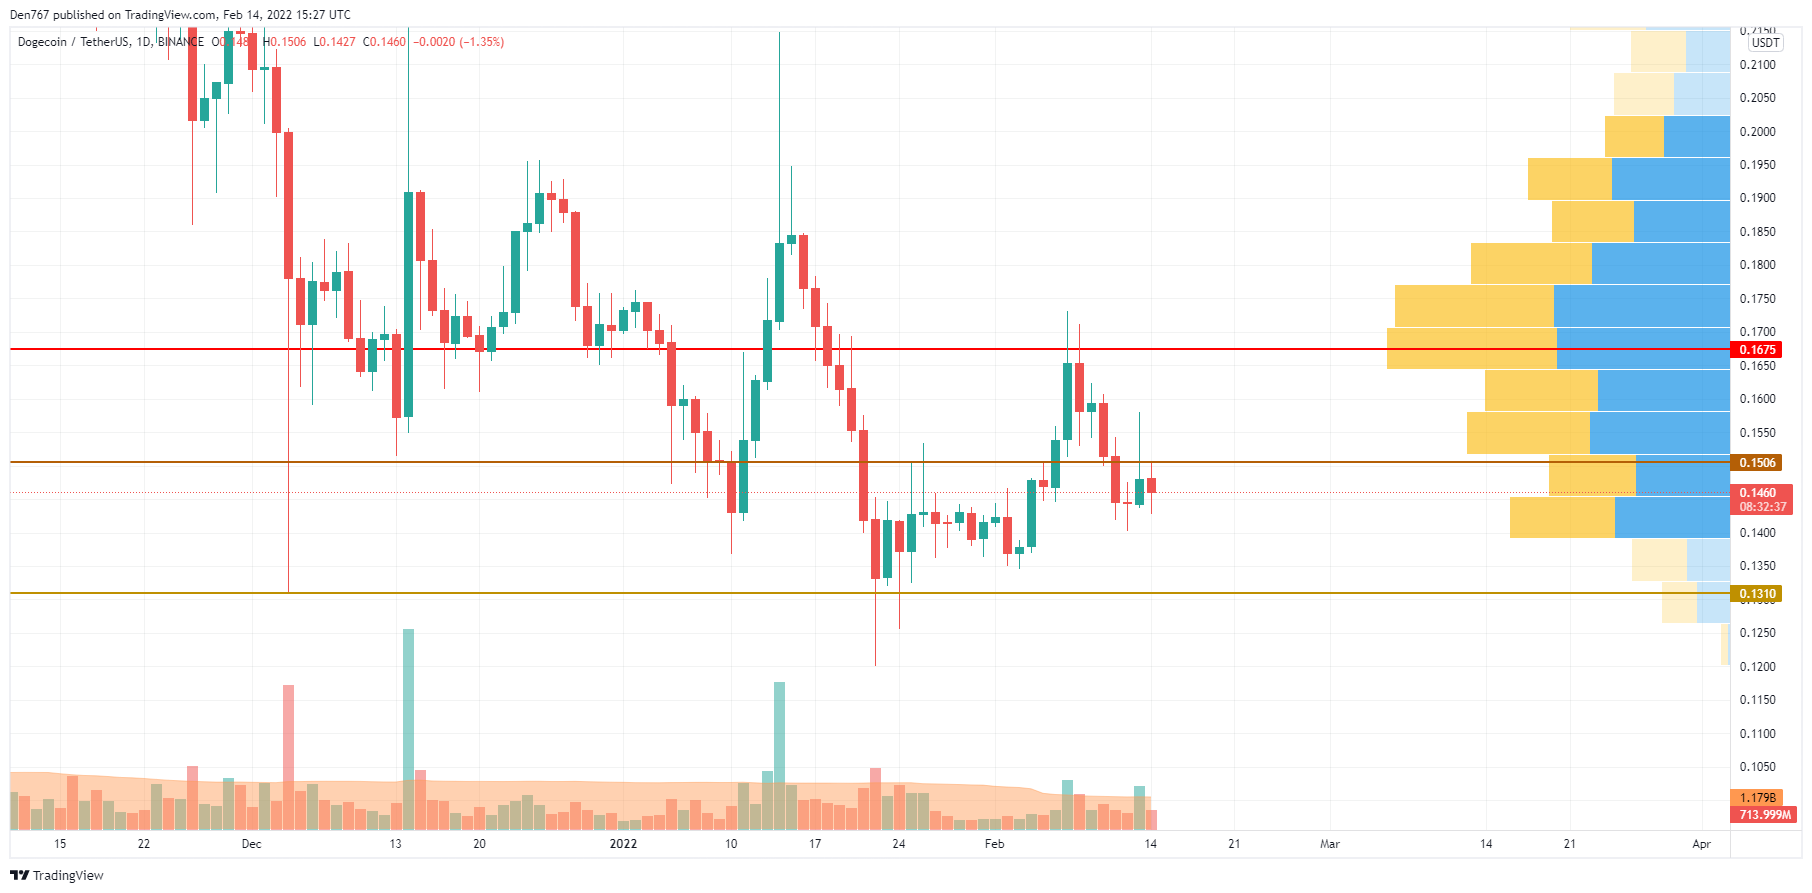
DOGE/USD
DOGE is the main loser today, falling by more than 5% since yesterday.
DOGE/USD chart by TradingView
Despite the fall, the price of the meme coin is located close to the resistance level at $0.1506. Thus, the buying trading volume is going up, confirming the bulls' power.
If the daily candle fixes around the $0.15 area, there is a high chance of seeing the breakout within the next few days.
DOGE is trading at $0.1461 at press time.
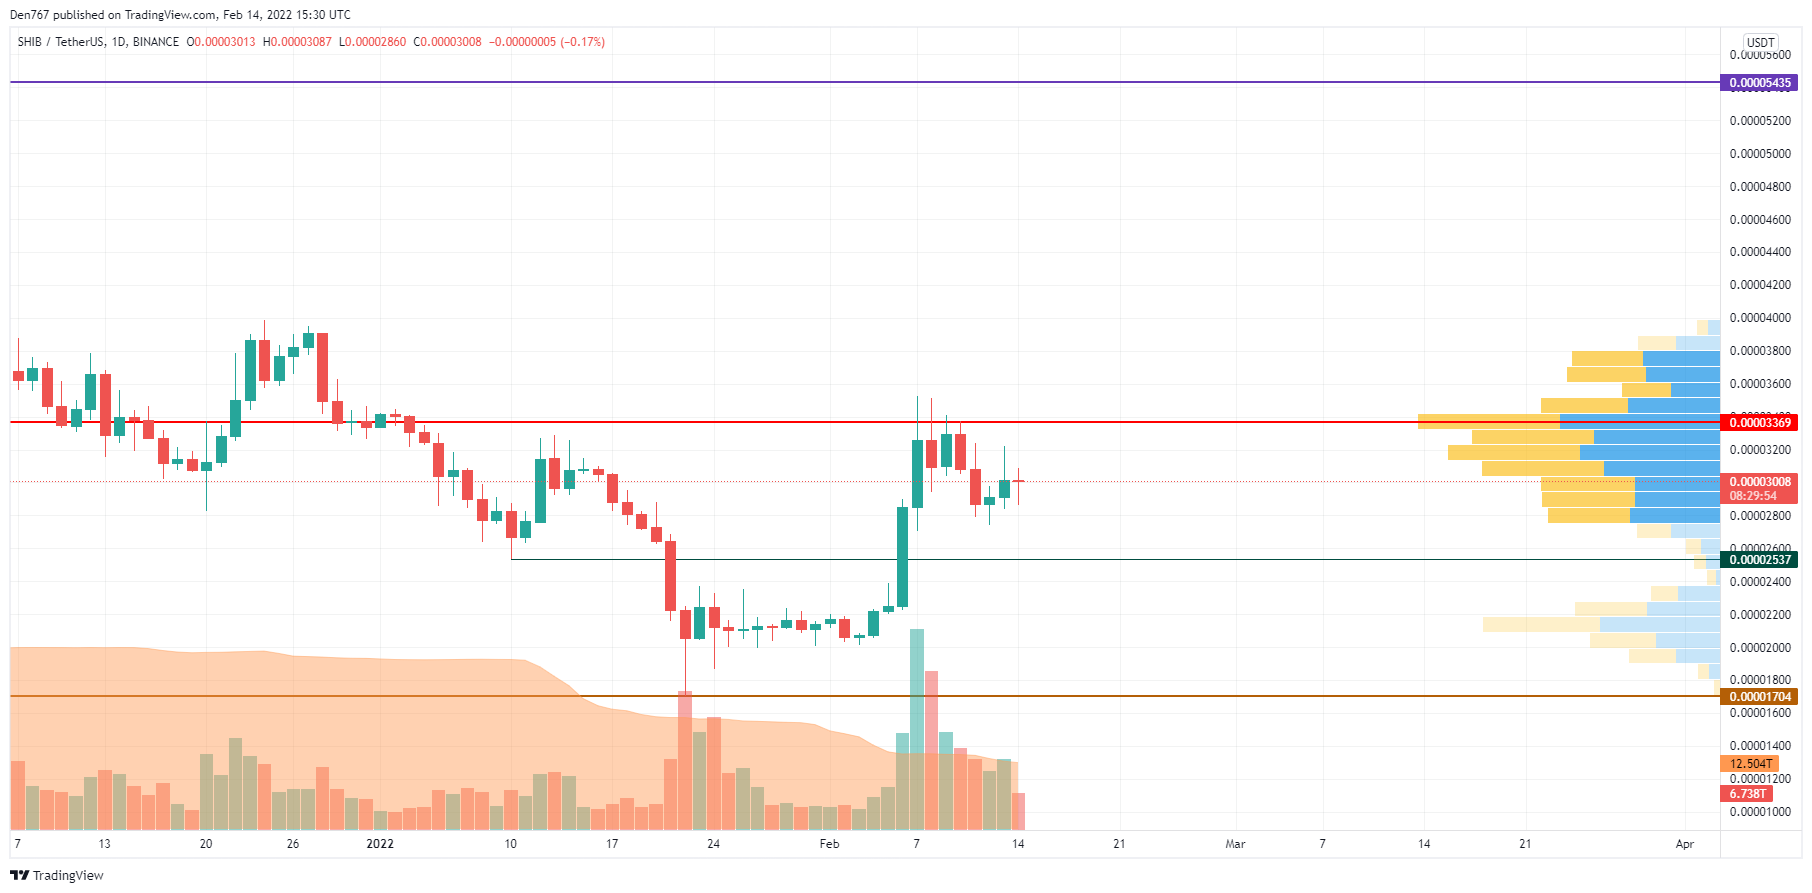
SHIB/USD
SHIB is outperforming DOGE, however, it is also under the bears' pressure, going down by 4%.
SHIB/USD chart by Trading View
Despite the fall, SHIB keeps trading in the channel between the zone of the most liquidity, which serves as the resistance, and the support at $0.00002537. If buyers can seize the initiative and get the rate to the mark of $0.000031, the price can break the resistance and go to $0.000040 until the end of the week.
SHIB is trading at $0.000030 at press time.


