
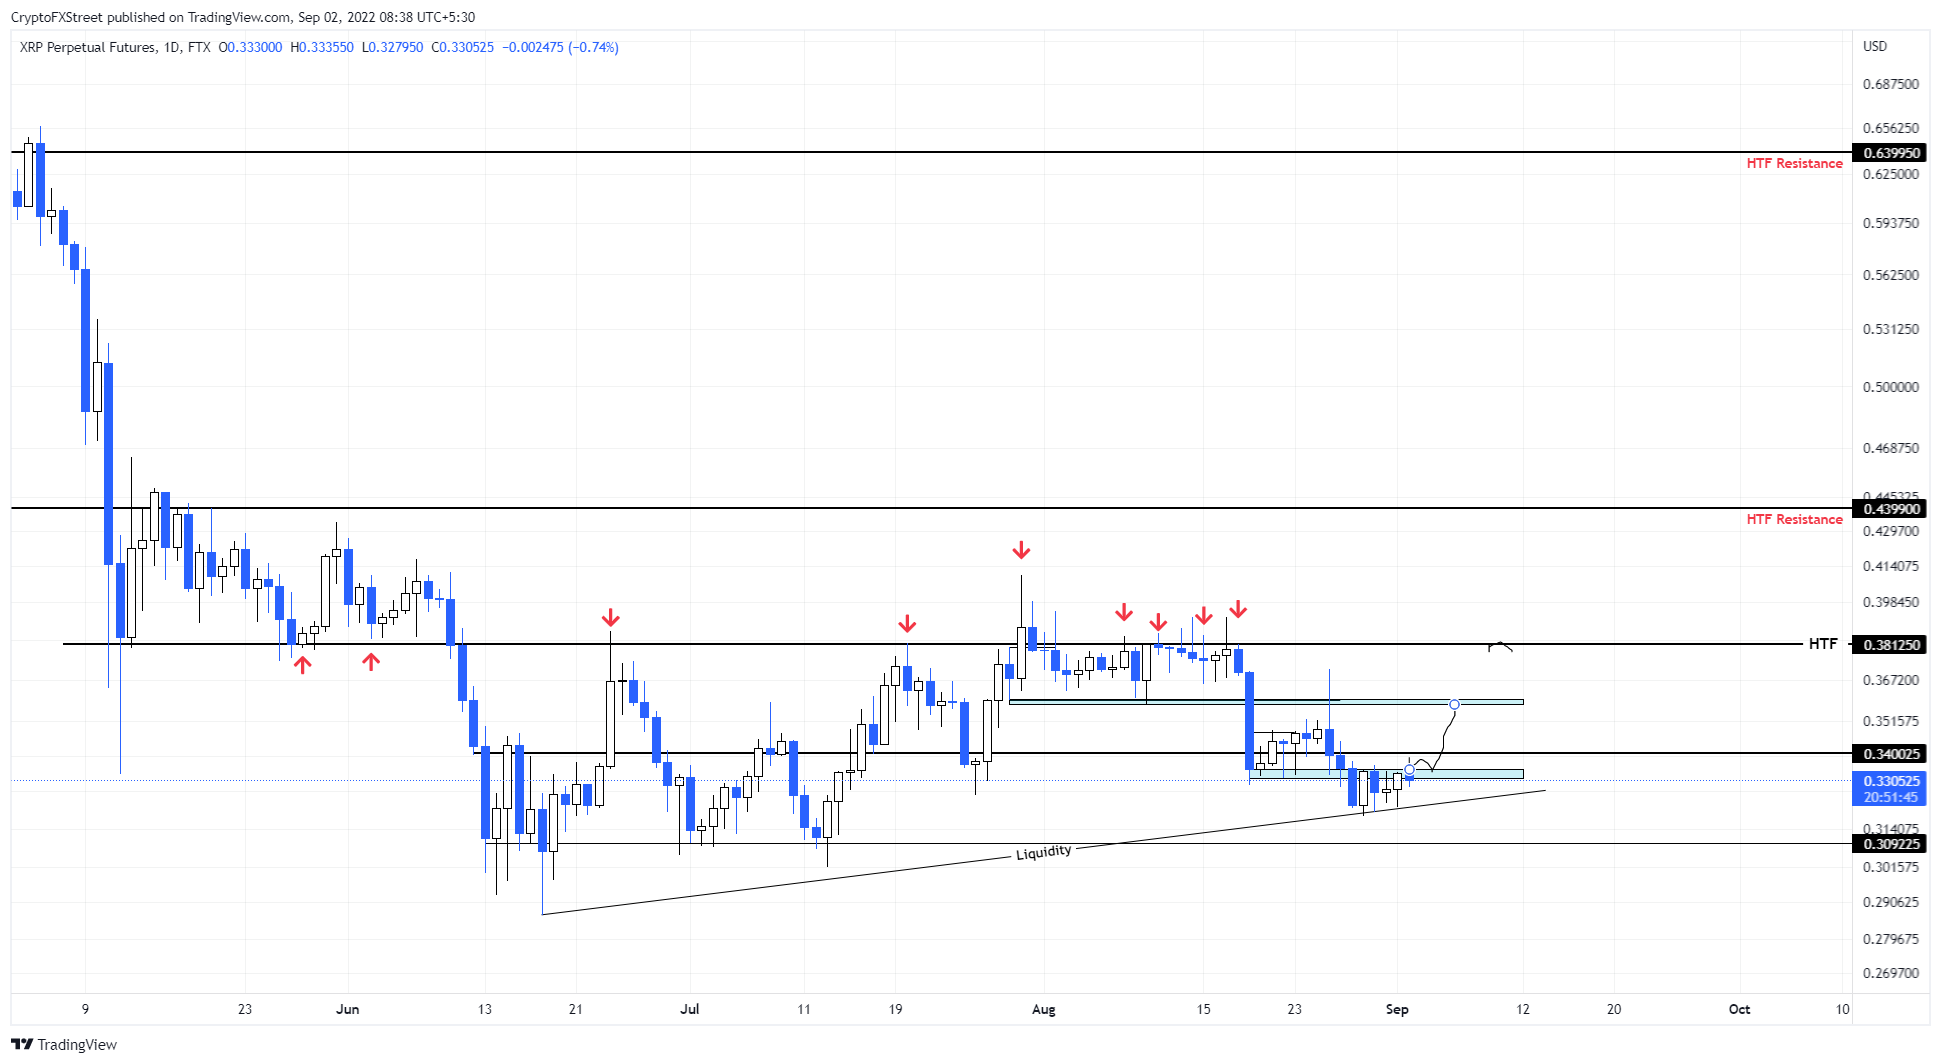
- Ripple price shows an ascending triangle formation spanning over the last two and a half months.
- This development could yield a conservative 7% to 15% upswing; a breakout could trigger a 25% ascent.
- A daily candlestick close below $0.318 will invalidate the bullish thesis and trigger a bearish breakout.
XRP price shows an ascending triangle formation, hinting at a bullish breakout. However, the altcoin is at a point where it could turn either way. Hence, investors must wait for double confirmation before jumping on this bullish trade.
Ripple price ready to make its move
XRP price has been producing higher lows and equal highs since June 10; connecting these swing points using trend lines results in an ascending triangle formation. This technical formation forecasts a 25% upswing, determined by adding the distance between the first swing high and swing low to the breakout point at $0.381.
Currently, XRP price is hovering around the bottom of the said pattern and has not given any discernable bullish hints except the ascending triangle formation. Therefore investors need to wait for a market structure shift, aka a flip of the $0.340 hurdle into a support floor.
This development will not only create a higher high and shift the market structure favoring the bulls, but it will also push buyers to start accumulating the remittance token. In such a case, investors can expect Ripple price to make a run for the immediate hurdle at $0.360.
Clearing this level will allow Ripple bulls to trigger a run-up to $0.381, which is an inflection point. A daily candlestick close above this barrier will reveal an ascending triangle breakout, which forecasts a 25% run-up to $0.477.
XRP/USDT 1-day chart
While the bullish outlook is logical and plausible, investors have no confirmation to start accumulating Ripple price at the current level of $0.332. Moreover, if Bitcoin price tumbles, there is a good chance the remittance token will follow.
In such a case, a daily candlestick close below $0.318 will create a lower low and invalidate the ascending triangle formation and potentially trigger a crash to $0.309, where buyers have a chance to come in and attempt recovery.


