
The new week has started with the continued fall of the cryptocurrency market as all top 10 coins are in the red zone.
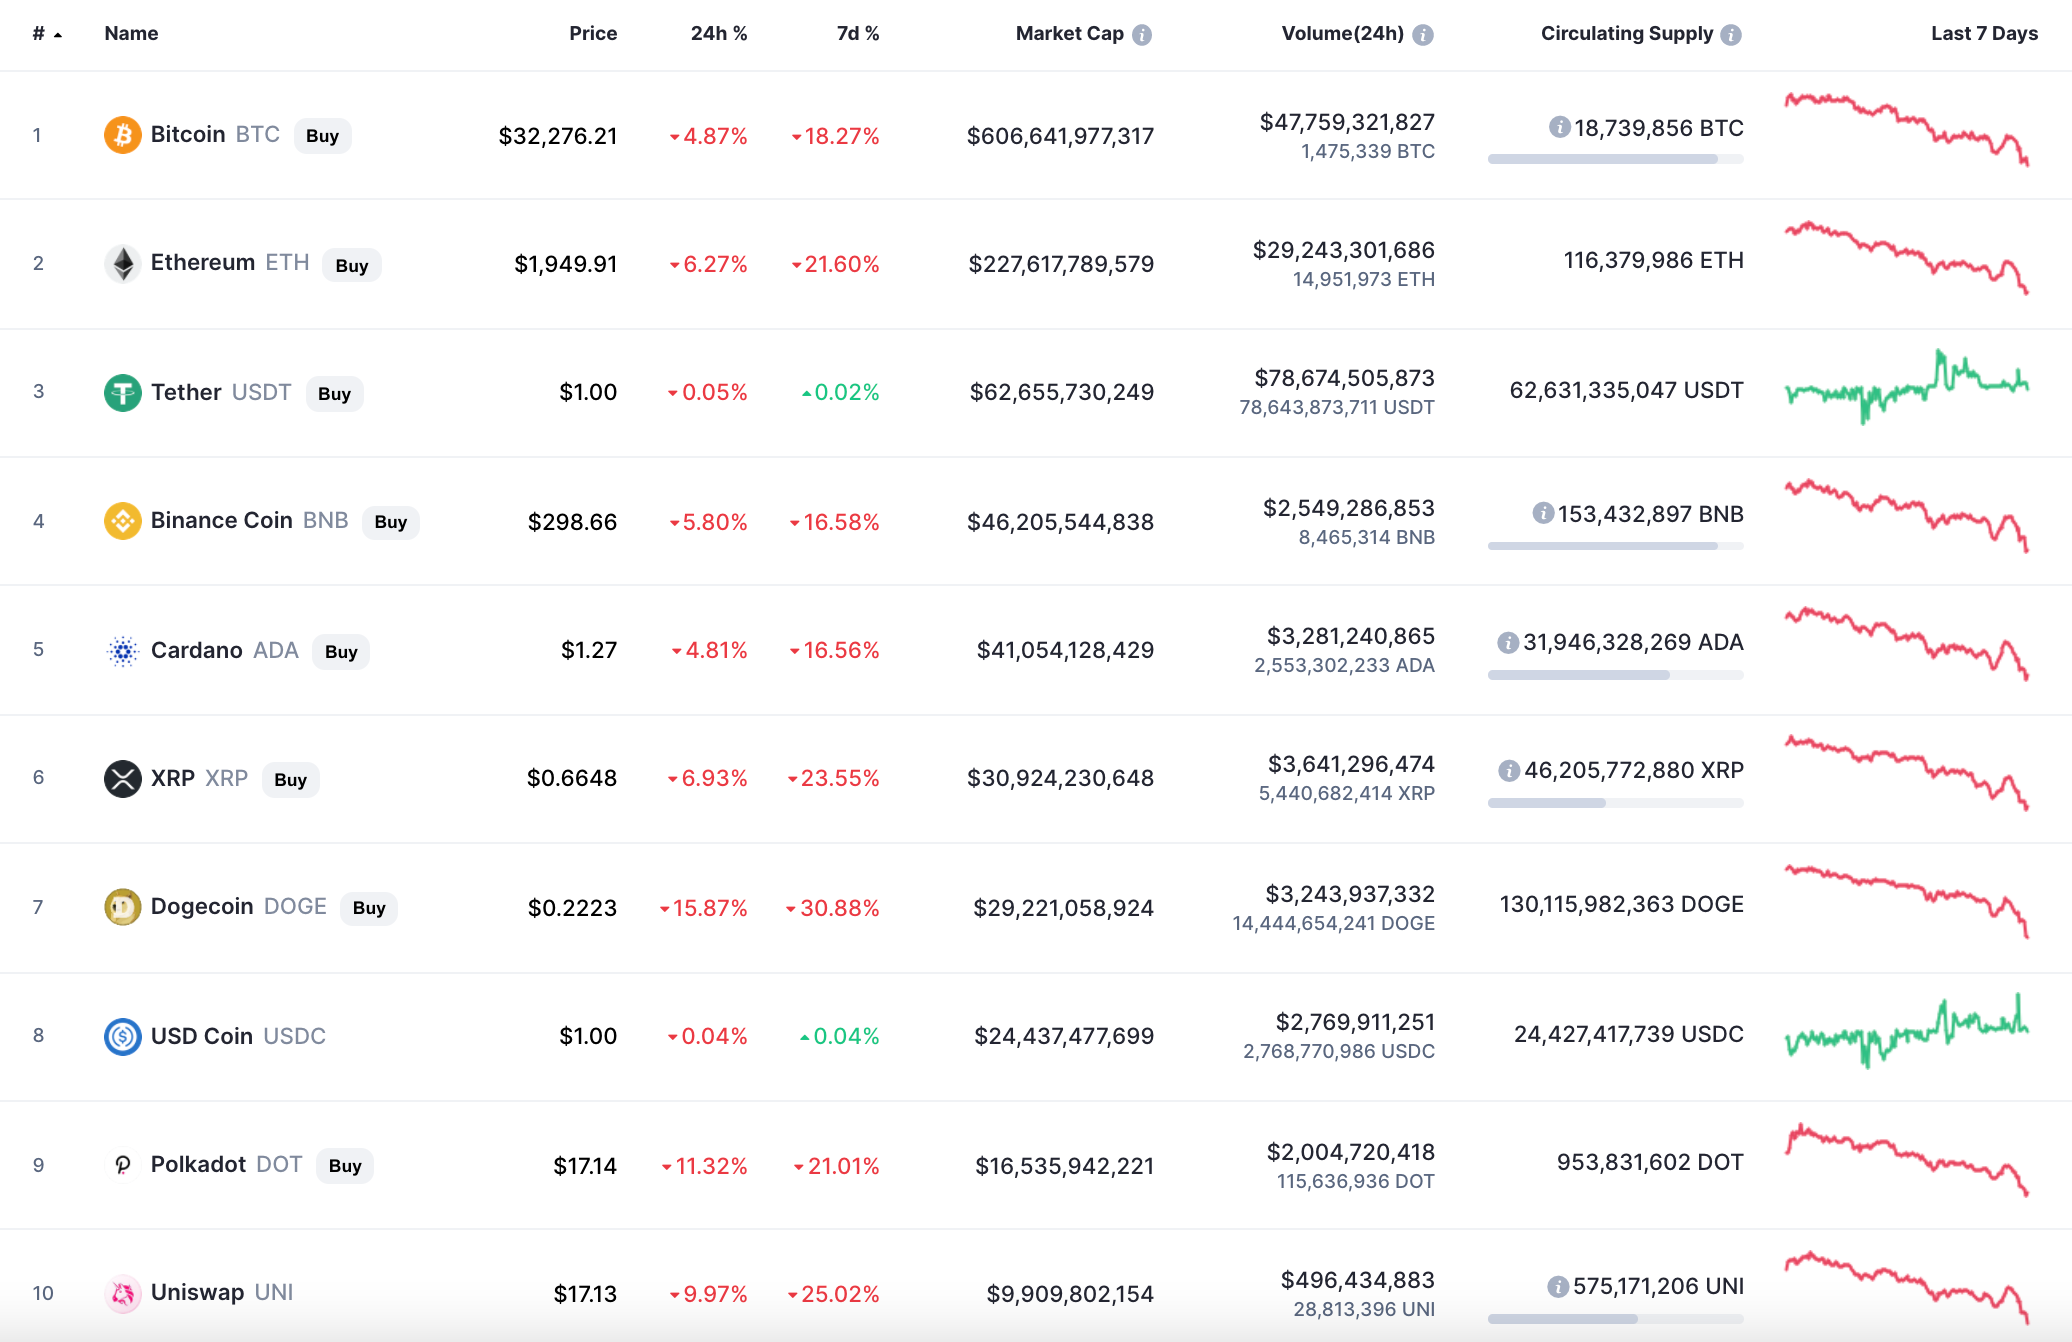
Top coins by CoinMarketCap
ETH/USD
The rate of Ethereum (ETH) has declined by 7% since yesterday while the price change over the last week has accounted for -23.54%.
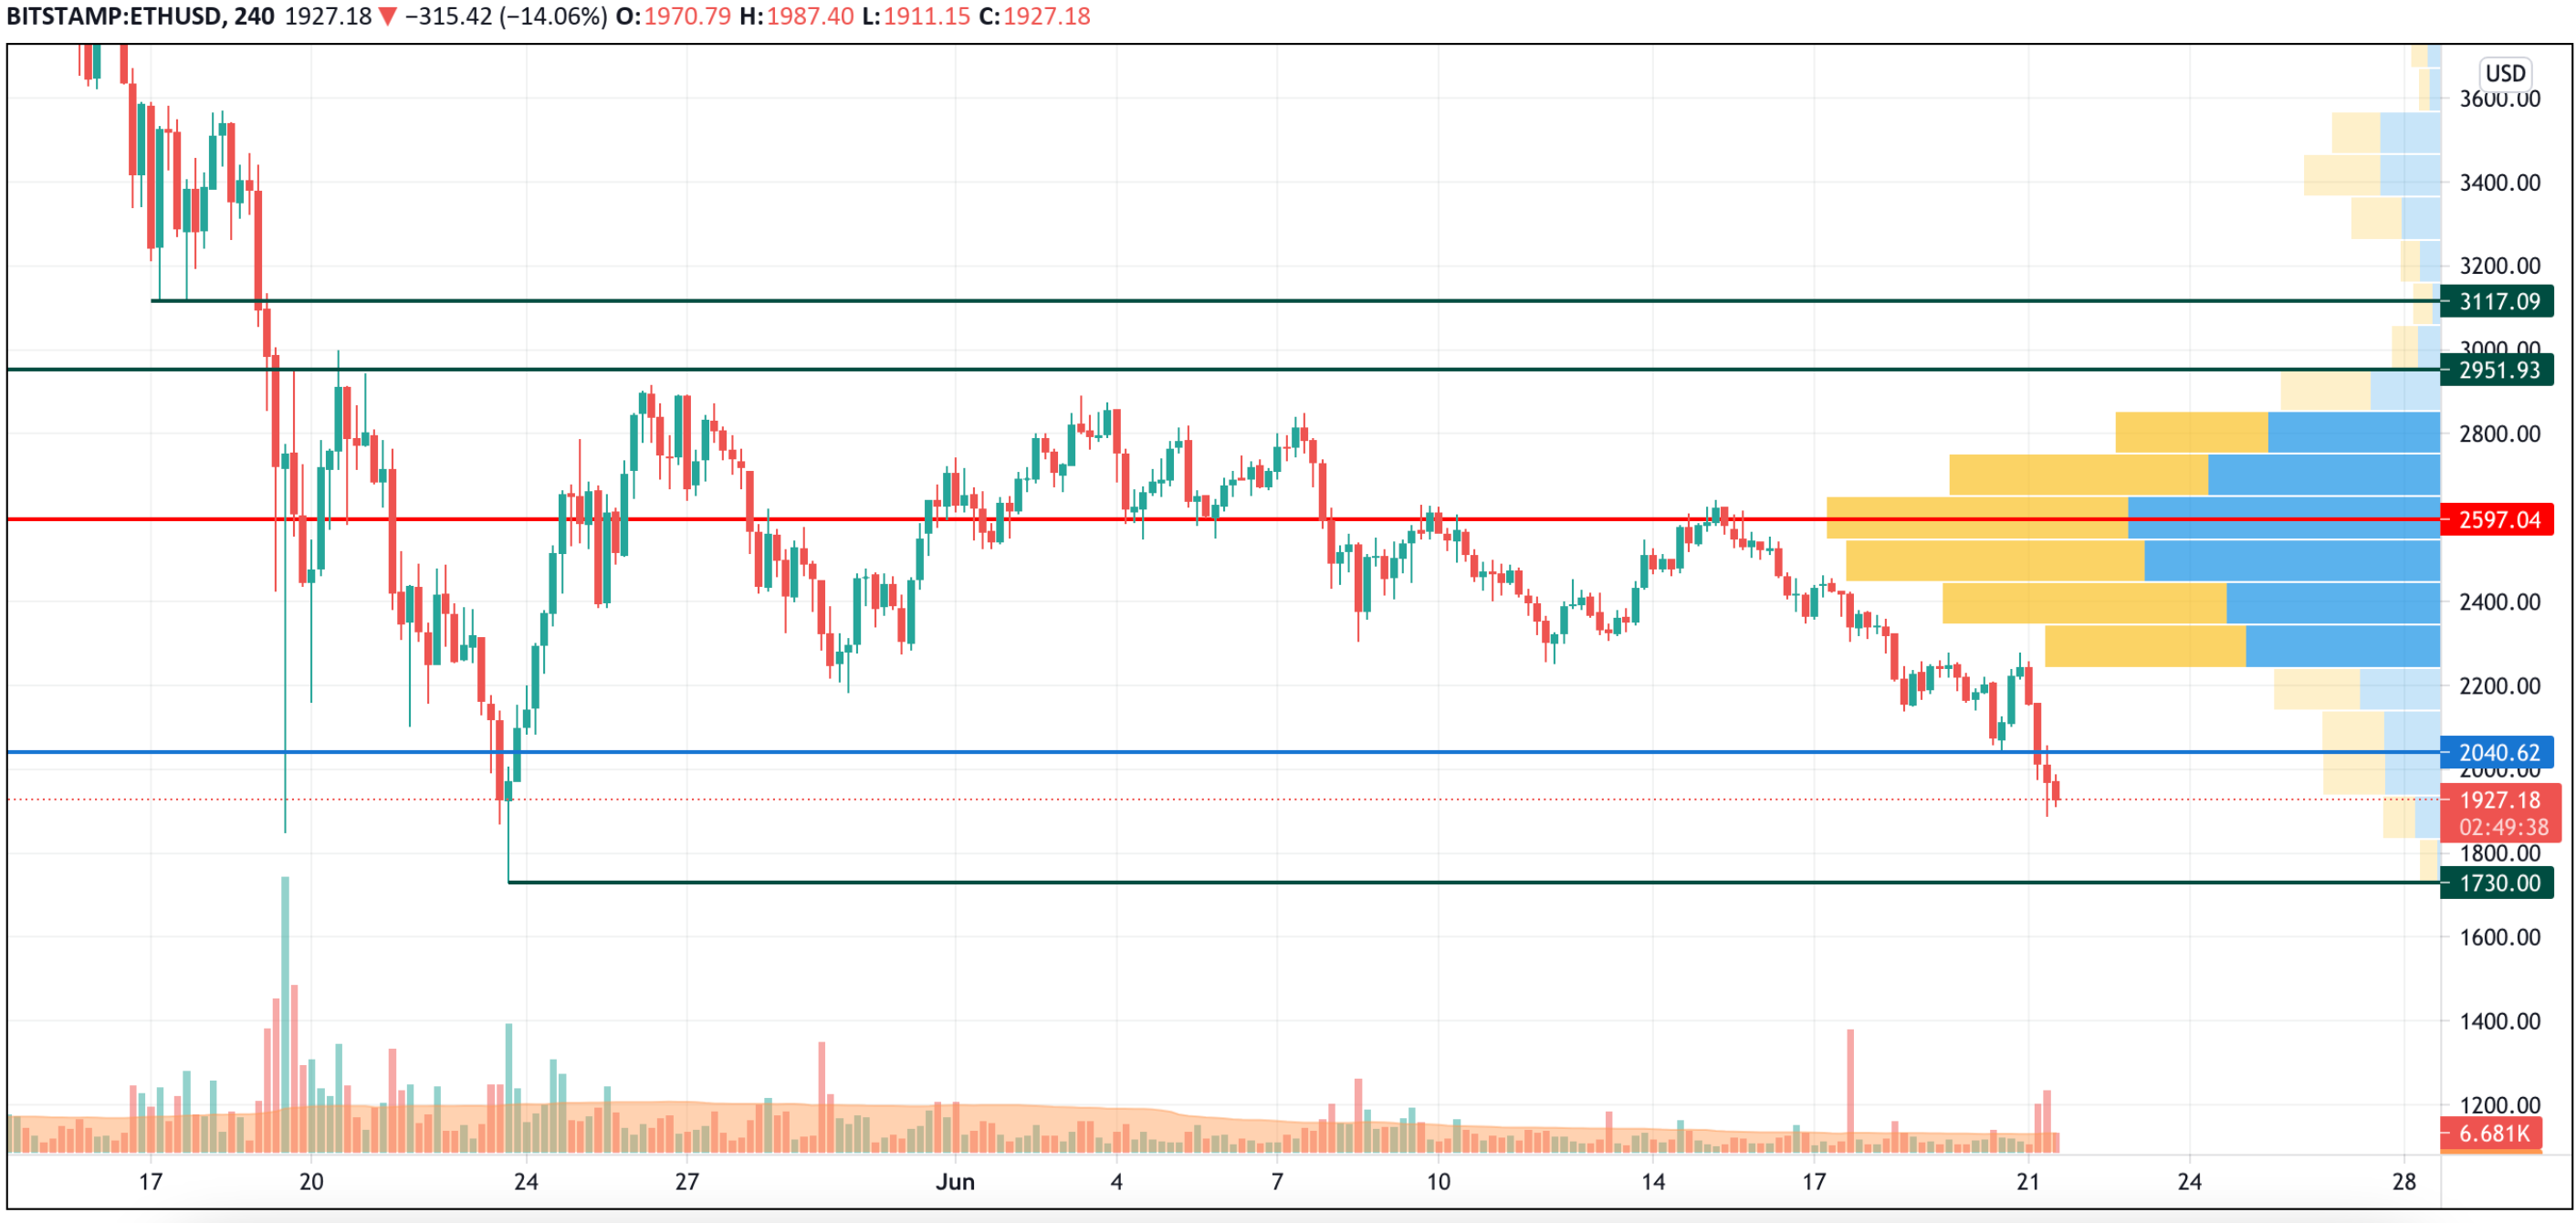
ETH/USD chart by TradingView
On the 4H chart, Ethereum (ETH) broke the support at $2,040 having confirmed the bearish influence. Despite the decline, the ongoing fall may continue supported by the high selling trading volume.
In this case, there is a high chance to see the price decrease to the next level at $1,730.
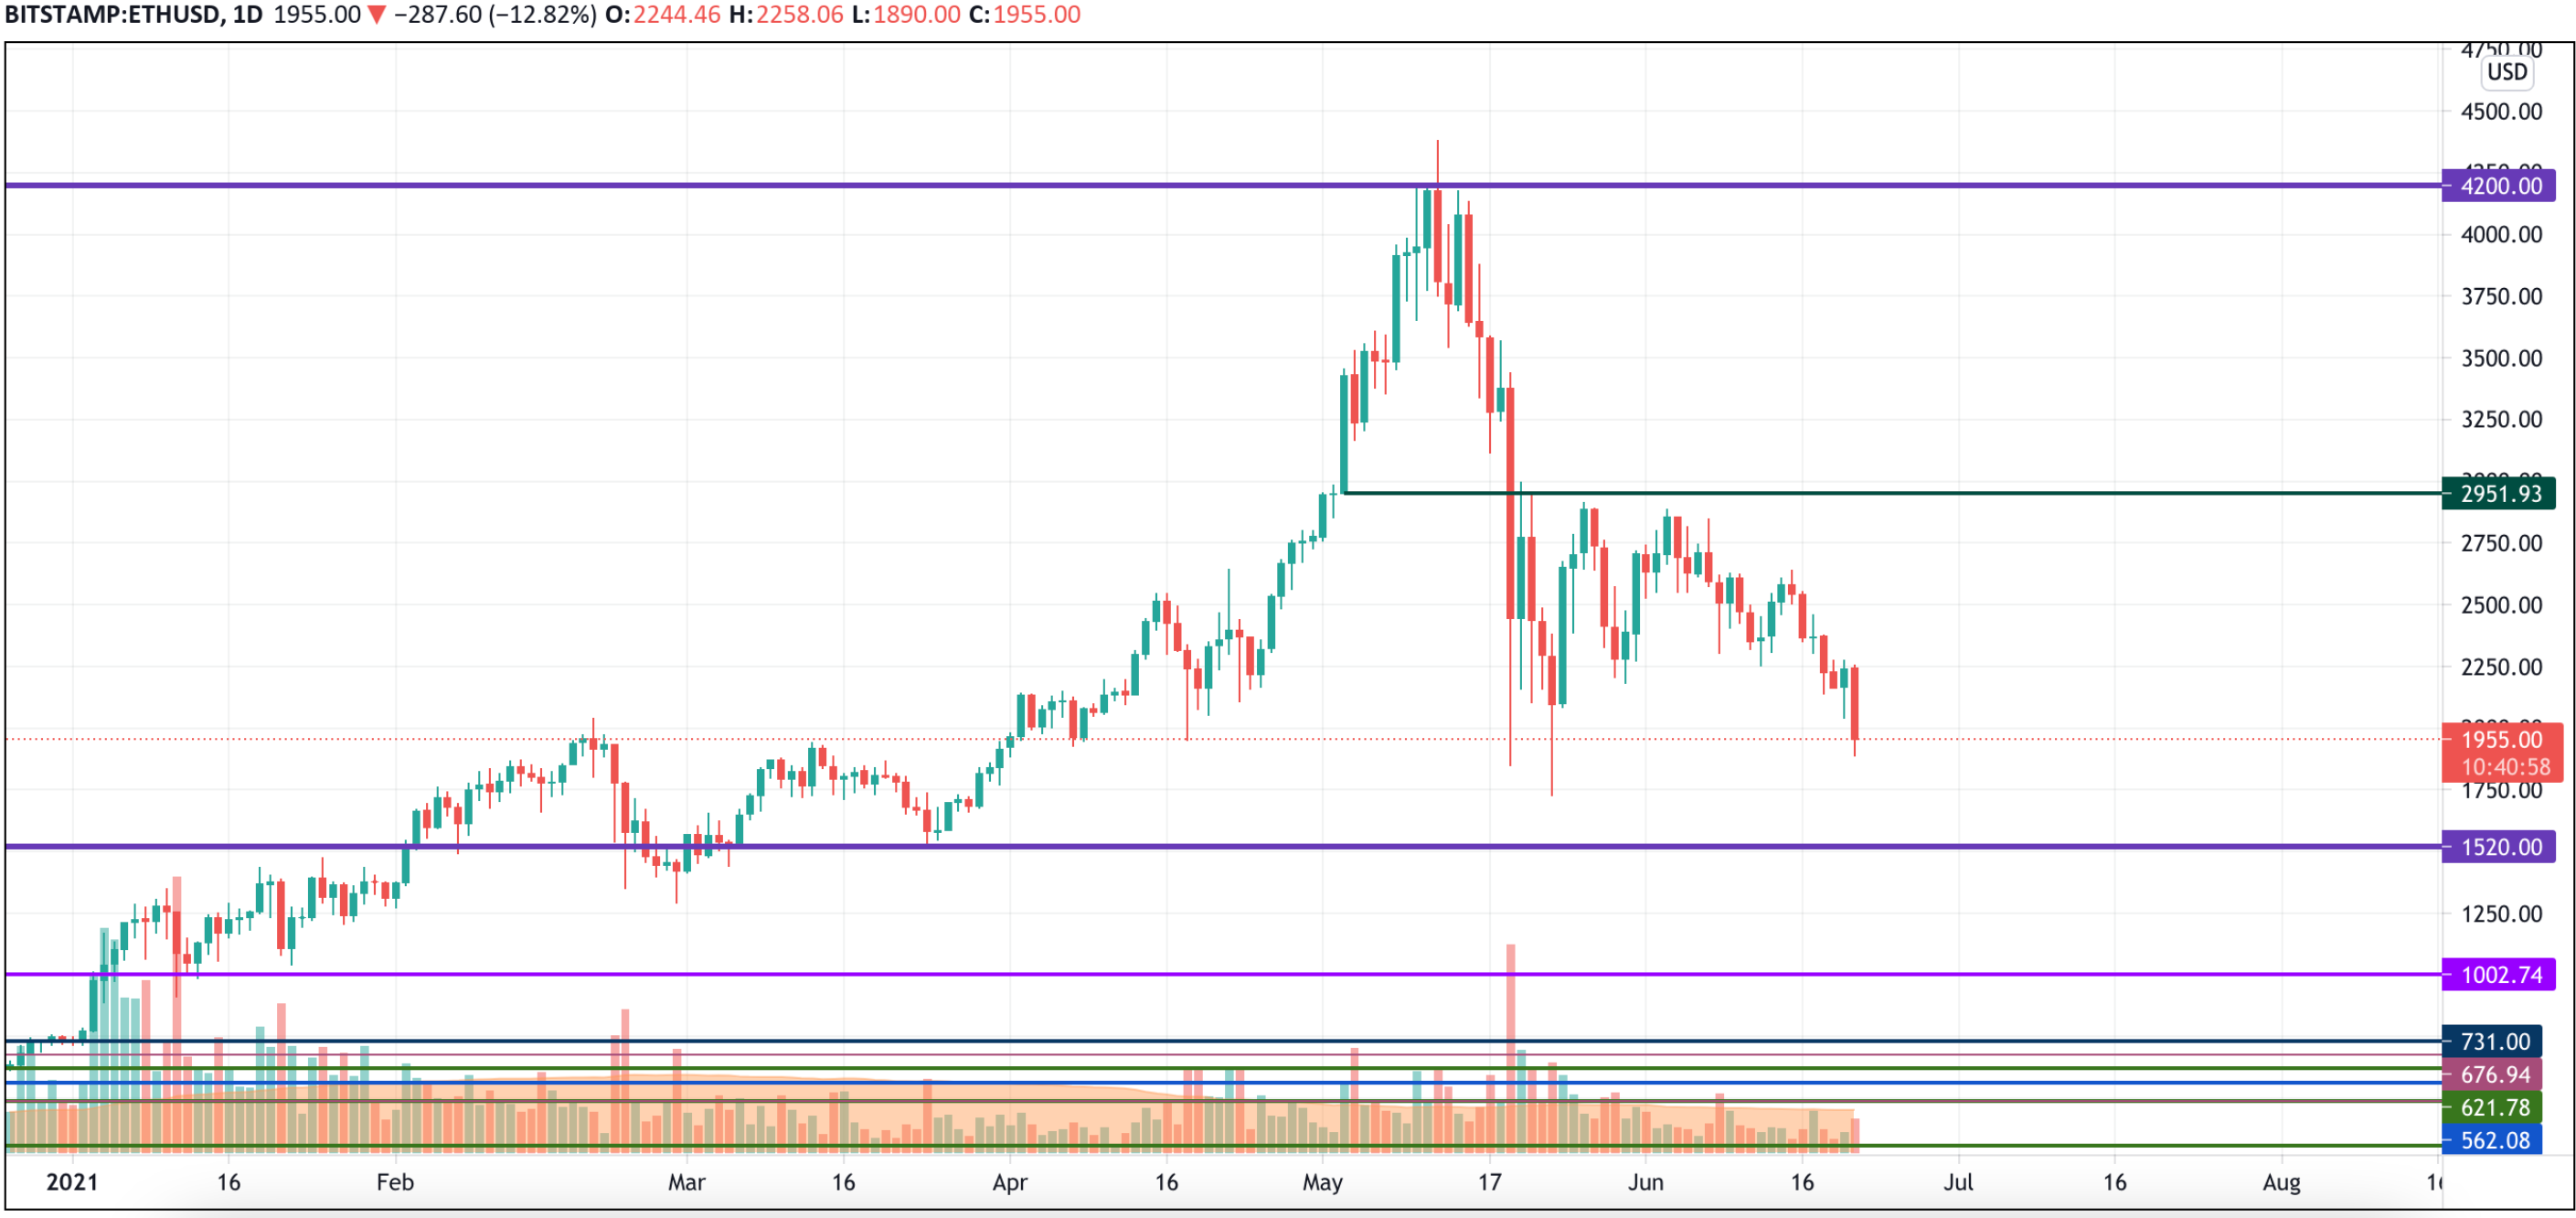
ETH/USD chart by TradingView
On the bigger chart, the mid-term scenario is also more bearish than bullish as Ethereum (ETH) has already fixed below the vital level at $2,000. Respectively, sellers might get the rate of the chief altcoin to $1,520 within the next days.
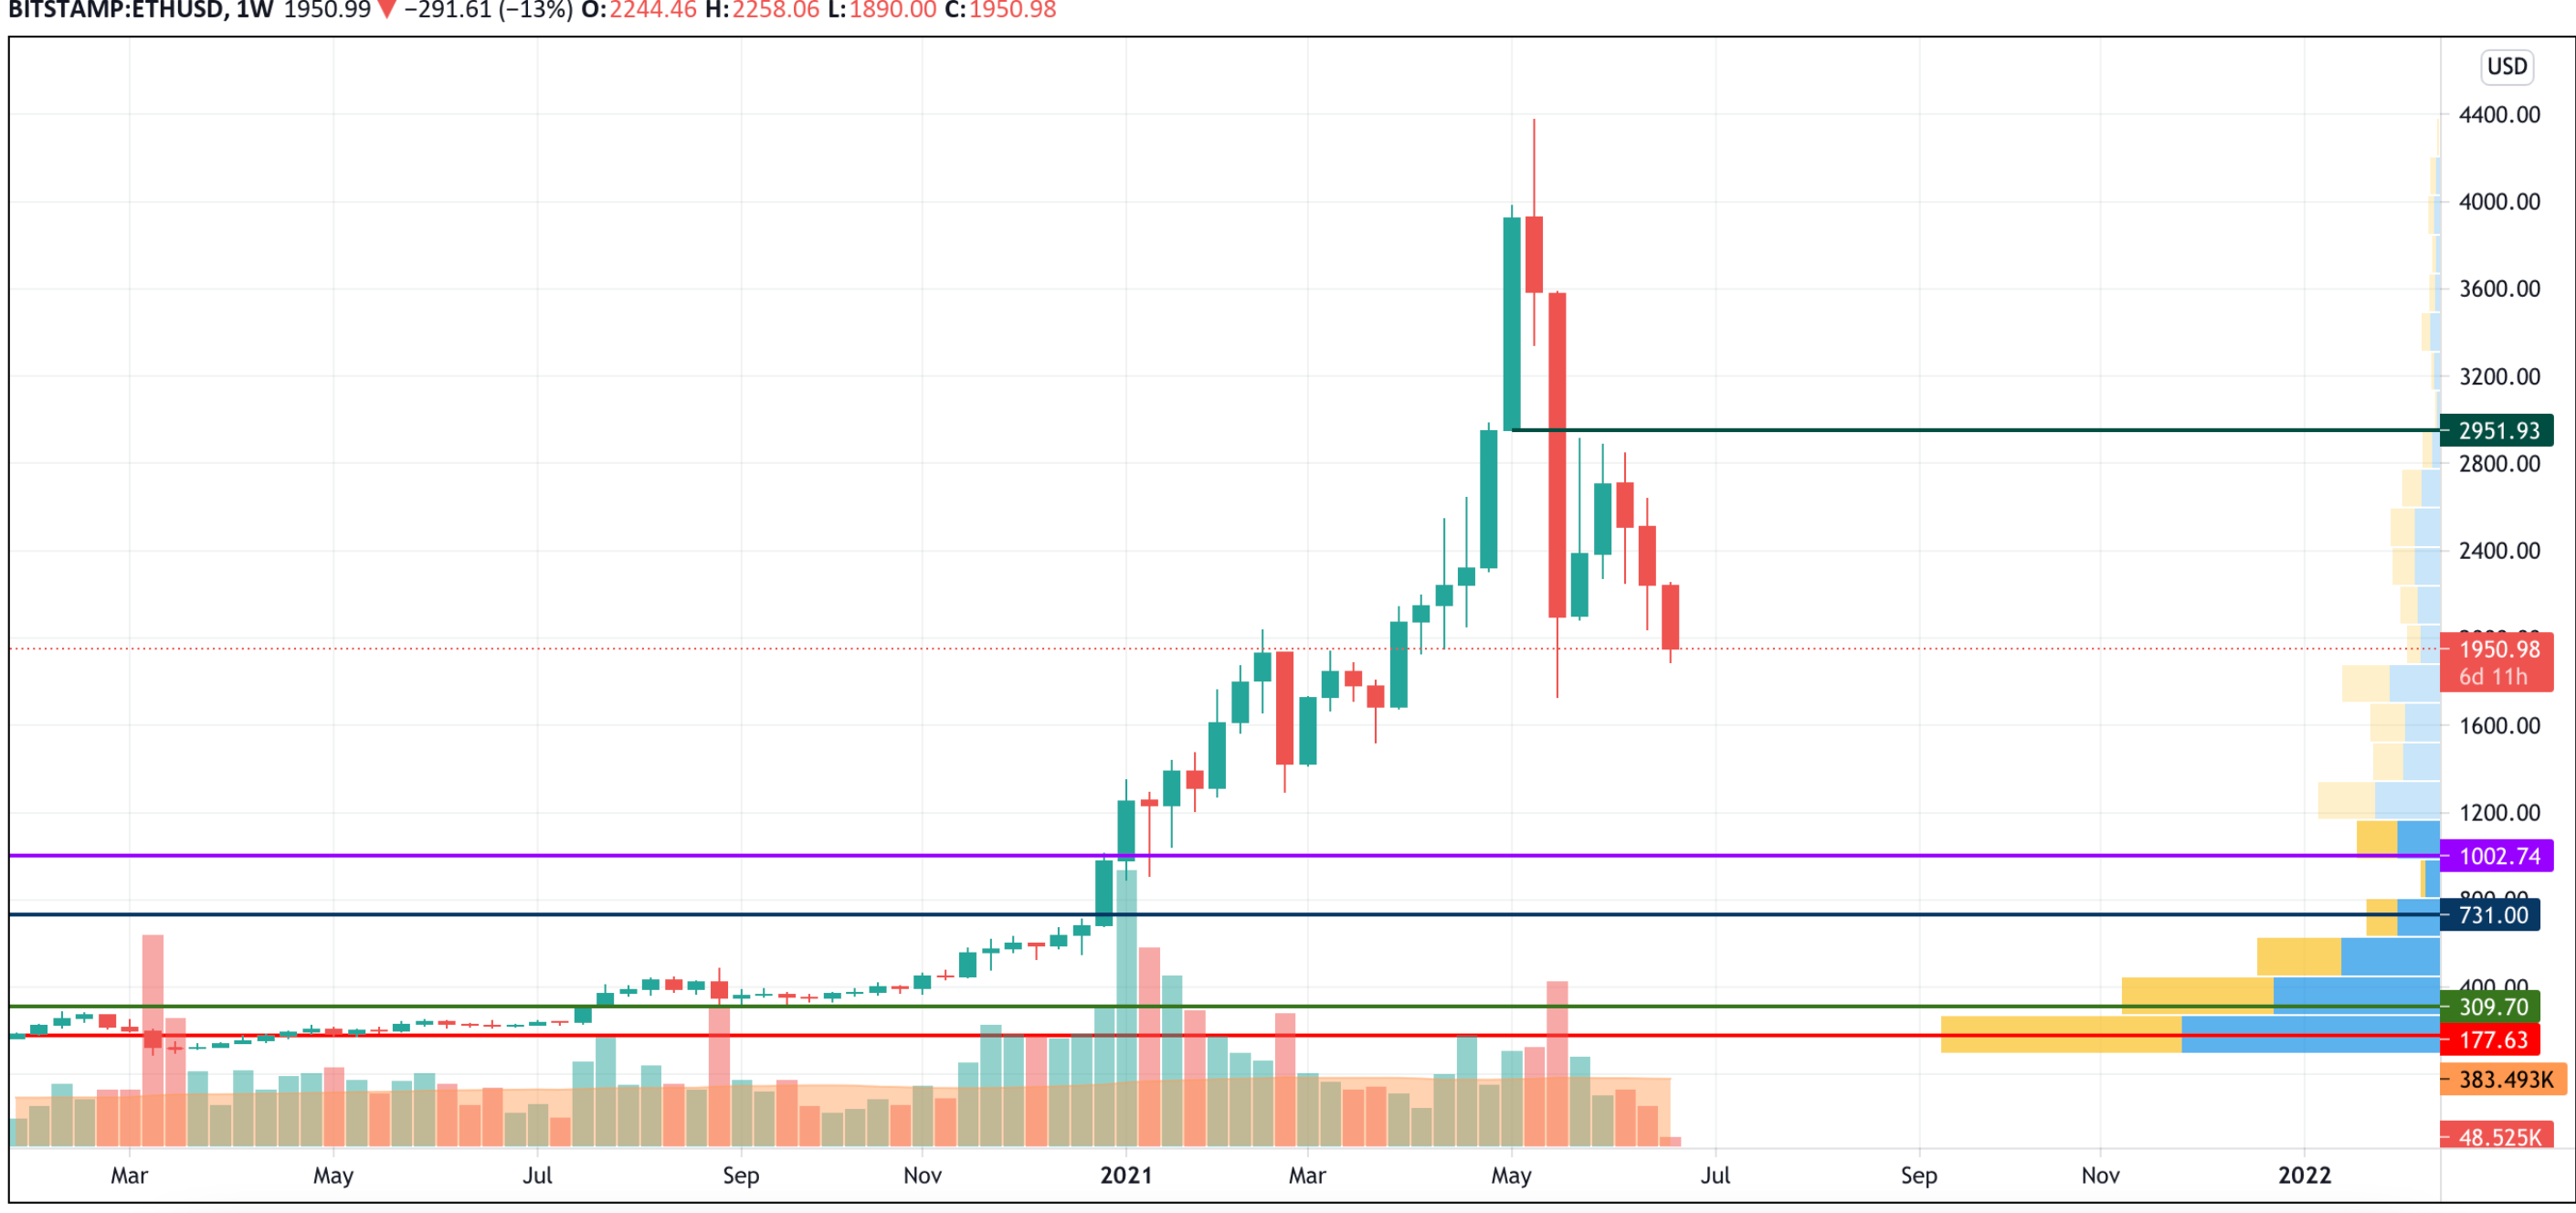
ETH/USD chart by TradingView
On the weekly time frame, the fall seems like it's not going to stop. That is why, Ethereum (ETH) can get to the level at $1,000 if bears can break the zone around $1,500.
Ethereum is trading at $1,956 at press time.


