
- Litecoin price closes with a Doji candlestick, indicating an interruption in the trend.
- Significant Fibonacci level restraining rally from reaching the all-time high.
- Litecoin price on pace to close with fourth-largest weekly gain since September 2020 low.
Litecoin price is currently 20% below 2017 high while trading in an ascending channel since the September 2020 low. Potential exists for LTC to reach the all-time, but the intra-day charts indicate that the boost in the early part of the week is exhausted, and Litecoin price is poised to at least retrace some of the strong performance.
Litecoin price is close, yet so far from fresh highs
A Doji candlestick pattern is formed when the open and close of an asset price are identical or nearly identical. It creates a real body that is close to being a horizontal line. The connotation of the candlestick pattern is that the market is in equilibrium and governed by indecision. It is a warning of a reversal and occurs anywhere during a trend, but its value is limited within a narrow consolidation.
On the 12-hour chart, Litecoin price closed with a Doji candlestick pattern and slightly above the critical 78.6% retracement level of the 2017-2018 bear market at $334.86, augmenting the importance. The inclusion of the Doji candlestick within this leg of the multi-month advance is a warning sign for traders and urges the need to consider the potential of a notable reversal in Litecoin price. A trade below the Doji will activate the bearish outlook.
Support will manifest at the ascending channel’s midline at $297.00, followed by the April low at $207.10. A further unraveling of Litecoin price would target the channel’s lower trend line at $197.80, representing a 40% in price and break in the trend of higher lows since October 2020.
Traders should also be aware that the weekly Relative Strength Index (RSI) continues to show lower highs, producing a bearish momentum divergence versus price. Another warning sign, but at a different time interval.
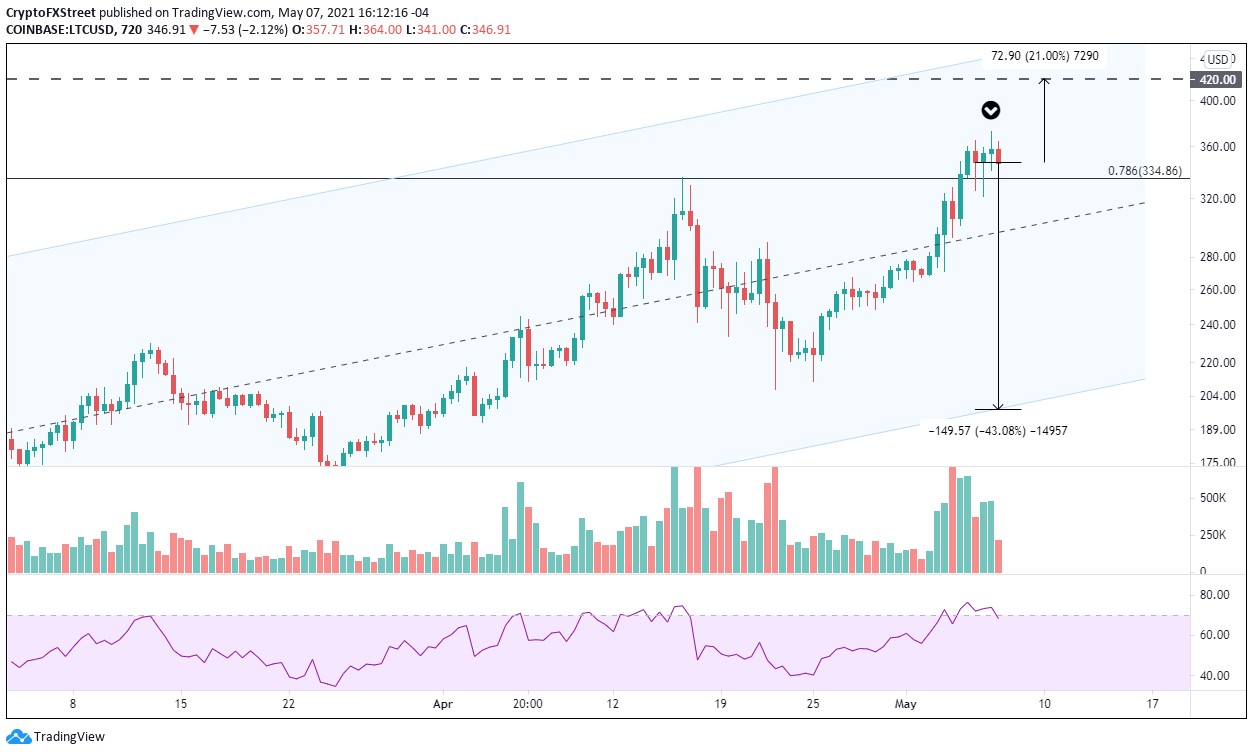
LTC/USD 12-hour chart
Several cryptocurrencies have managed to test their longstanding all-time highs in the last few weeks or months, such as SXP (Stripe), and it is undoubtedly an outcome to be expected for Litecoin price in the coming days or weeks. There are no technical levels to offer resistance, so a rally continuation can not be steadfastly overruled. Potential targets will need to be evaluated at the time of a new high to ensure real-time indicator values.


