
- Litecoin price rests at the intersection of two significant support levels.
- Largest eight-day decline since March 2020.
- LTC no longer a top-10 cryptocurrency by market capitalization.
Litecoin price came within six points of testing the 2017 high at $420 on May 10 before initiating a notable decline. LTC has reached a vital level that suggests the downside will be limited from price at the time of writing ($262.87). It is the ideal location for the payments token to begin a bottoming process to make another attempt at the all-time high.
Litecoin price has impressive upside potential
At the May 10 high at $413.91, Litecoin price had rallied almost 240% in 2021. A significant gain, but not near the contenders for the best gain of the year. The rally was confined to an ascending channel formation with the Litecoin 50-day simple moving average (SMA) and Ichimoku Cloud offering tangible support during the corrections.
At the May 9 high, Litecoin price had recorded a 73% gain over the previous 14 days, making it the best return since December 2020 and the second-best since 2018. On the same day, the daily Relative Strength Index (RSI) registered the highest reading since February and equaled a level that has coincided with LTC corrections going back to August 2020.
Since the May 10 high, Litecoin price has fallen 36% and currently shows a decline of 29% over the last eight days, marking the largest eight-day decline for Litecoin since the March 2020 cryptocurrency crash. Due to the deterioration, LTC has fallen out of the top-10 cryptocurrencies by market capitalization.
Presently, Litecoin price rests at the confluence of the 50-day SMA and the Ichimoku Cloud. Selling pressure may continue in the near term, but it should be contained by the cloud, considering the oversold condition highlighted by the eight-day decline of 29%.
The rebound will strike resistance at the midline of the LTC ascending channel at $315.85, then test the all-time high at $420.00, yielding a 58% gain. A successful breakthrough at the all-time high would usher in a test of the channel’s upper trend line at $462.37.
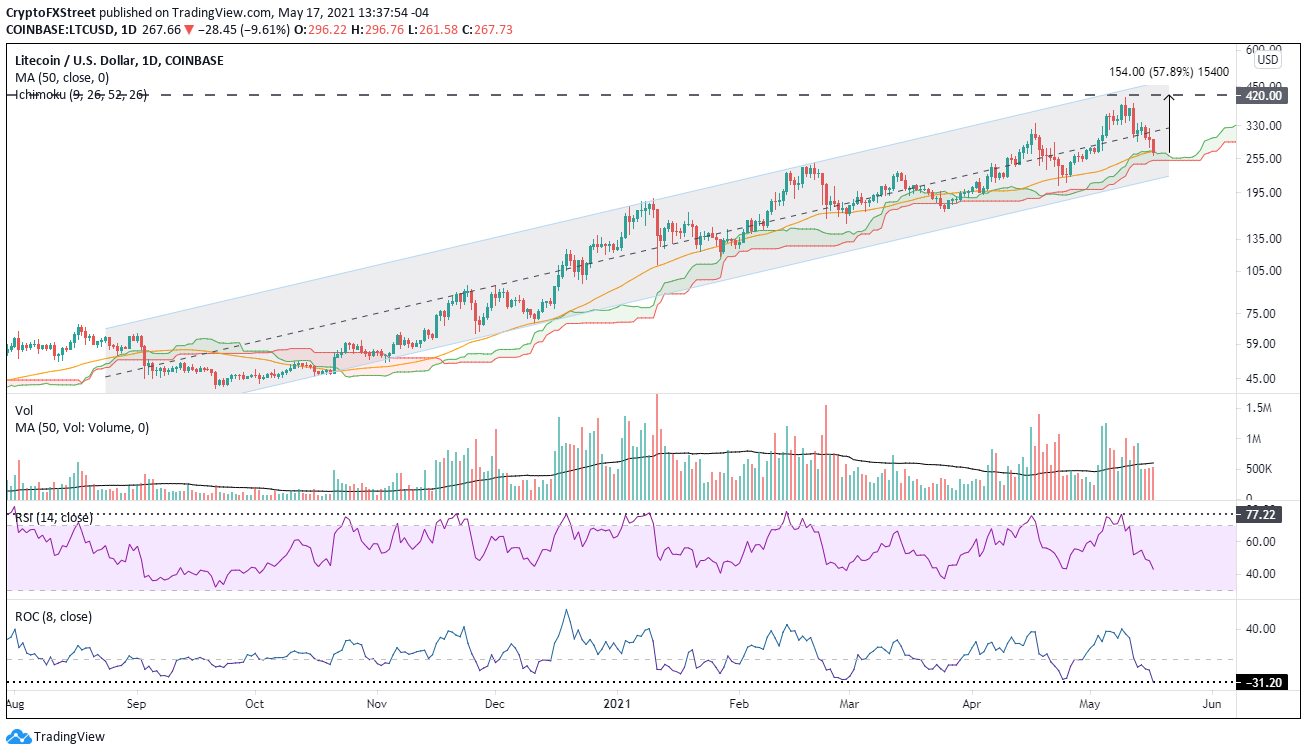
LTC/USD daily chart
If Litecoin price is unable to hold the lower limits of the Ichimoku cloud at $251.57, it will test the channel’s lower trend line at $214.16. Such a bearish impulse represents an additional loss of 20% for LTC.


