
- Litecoin price is down nine consecutive days and -24% in July, while reaching a new correction low today.
- Daily Relative Strength Index (RSI) is now the most oversold since March 2020, indicating a bounce could soon materialize.
- IntoTheBlock IOMAP metric presents no support for LTC down to $92.48.
Litecoin price has corrected 75% from the May high to today’s low of $104.02. Still, the current falling wedge pattern combined with oversold technical indicators, such as the RSI and Percentage Price Oscillator (PPO), propose that LTC may be near a rebound, even though the IOMAP metric communicates an absence of support below the current price.
Litecoin price attracting sale hunters after new low
Since the May collapse, headlined by the -36% crash on May 19, Litecoin price has patiently molded a falling wedge pattern with exceptional support at the confluence of the June 19 high of $146.00 and the 50-week SMA at $139.61. However, the protection awarded by the price levels was fractured last week and continues into this week with a -8% decline at the time of writing, leading to today’s test of the 78.6% Fibonacci retracement level of the 2020-2021 advance at $108.23 and a sweep of the June low at $105.00.
The result of the weakness, and accented by the nine consecutive down days, is an oversold reading on the daily RSI and an extreme negative deviation from the 200-day SMA based on the PPO, currently at -44.45%. Combined, the indicators highlight a cryptocurrency that could be primed for a rebound, even if the market does not cooperate.
To trigger exposure to LTC, Litecoin price needs to trade above $115.06, preferably on a daily close. If successful, the digital asset is unfettered until the upper resistance line of the falling wedge, currently at $130.00. An additional profit target is the merger of the 2017 high of $146.00 with the 50-day SMA at $146.70, rewarding investors with a 27% profit from the entry price of $115.06.
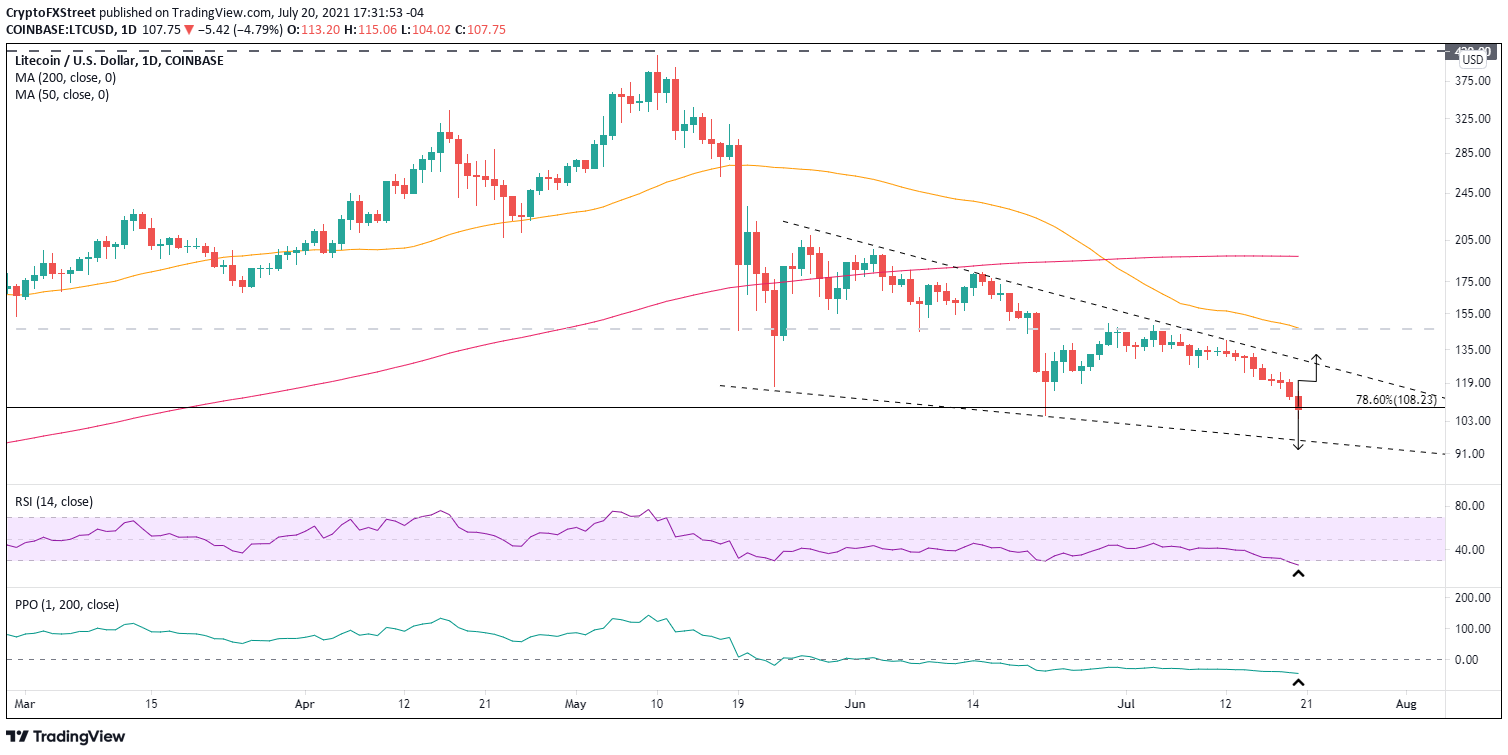
LTC/USD daily chart
As Litecoin price does stage a rebound from the intra-day low, LTC investors need to consider the consequences if the altcoin closes below the June 22 low of $105.00. Litecoin price would be exposed to a decline to the lower support line of the falling wedge around $95.50, which is just beyond the 200-week SMA at $96.57, representing a drop of approximately 12% from the current price.
The IntoTheBlock In/Out of the Money Around Price (IOMAP) metric offers a mixed outlook, defined by no support down to $92.50 and heavy resistance from $112.30 to $125.39. Based on the metric, Litecoin price is not well-positioned to sustain today’s rebound and will fall to the wedge’s lower support line at $95.50 and potentially lower.
For today, Litecoin is not hassled with resistance (out of the money addresses) until $112.30-$115.29, where 11.84k addresses hold 1.17 million LTC at an average price of $114.38, which correlates closely with the trigger price of $115.06. Additional large clusters of resistance up to $125.39 reveal a challenging path to the wedge’s upper resistance line at $130.00 moving forward.
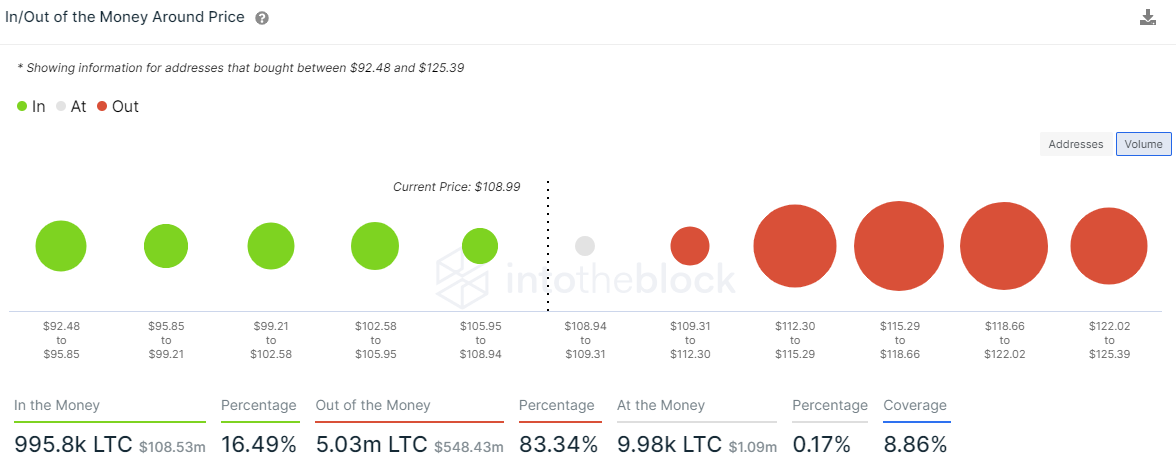
LTC IOMAP – IntoTheBlock
Overall, the IOMAP metric supports a test of the wedge’s lower support line and refutes the outlook for a swift rebound, at least in the short term.
Litecoin price action has mirrored the broader cryptocurrency market in July. Still, the emergence of extreme oversold conditions and the appearance of dip buyers today encourages a better outlook for the digital token. Nevertheless, as the IOMAP data hints, LTC is not ready to take the podium and claim a position of relative strength in the cryptocurrency market.
Here, FXStreet's analysts evaluate where LTC could be heading next.


