
- MATIC price develops bear trap, creating a short-squeeze opportunity for bulls.
- Key bullish entry levels are necessary to prevent a selloff.
- Downside risks remain despite bullish reversal signals.
MATIC price remains inside a broader rising wedge pattern on its candlestick chart and has struggled to find support. However, the Point and Figure chart shows that a move above $1.70 could trigger some intense buying pressure and deny bears their selloff.
MATIC price prepares for a nearly 50% price spike higher despite current downside risks
MATIC price has a long opportunity on its $0.05/3-box Reversal Point and Figure chart. The long idea is a buy stop order at $1.75, a stop loss at $1.55 and a profit target at $2.55. The entry would complete a breakout out of a double-top while simultaneously confirming a bullish Point and Figure reversal pattern known as a Bear Trap.
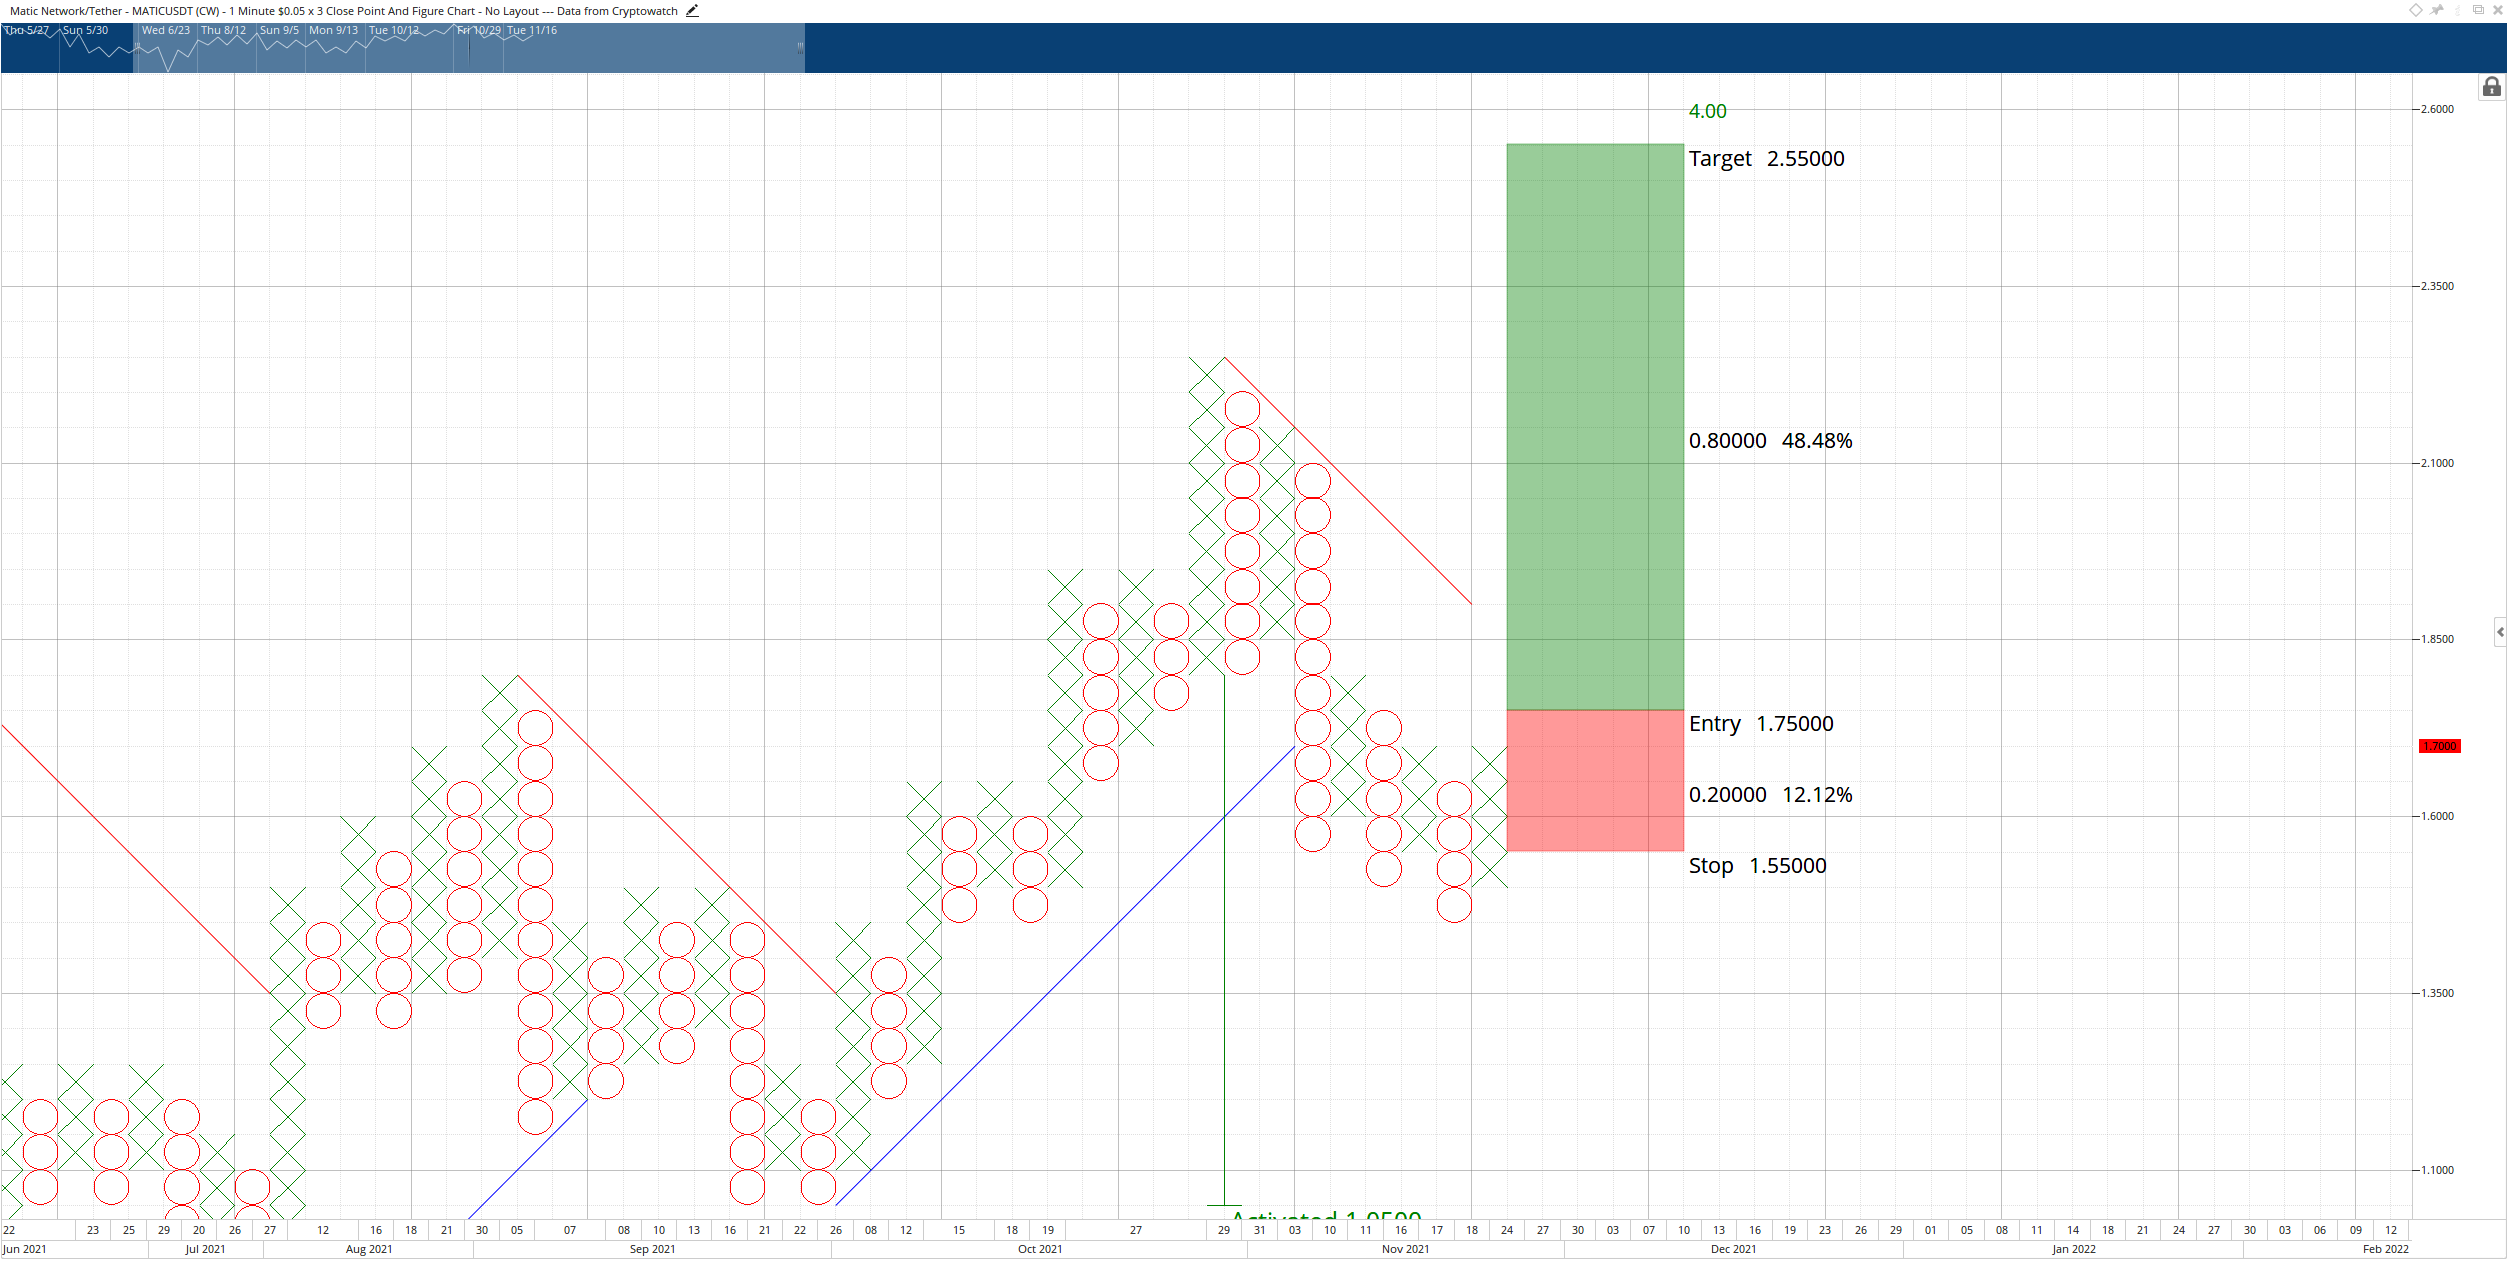
MATIC/USD $0.05/3-box Reversal Point and Figure Chart
Buyers are not entirely out of bearish territory, however – the daily Ichimoku chart shows MATIC is very close to completing an Ideal Bearish Ichimoku Breakout entry. The 50% Fibonacci retracement at $1.53 is acting as immediate support, but failure to hold there means MATIC price could drop even lower.
MATIC price will enter a capitulation zone at or below $1.40. A close at $1.40 would position MATIC price below the Cloud, the 100% Fibonacci expansion, and the lower trendline of the rising wedge pattern. More importantly, though, the Chikou Span would be below Senkou Span B. A close at $1.40 would mean MATIC may not find support until the 161.8% Fibonacci expansion at $0.95.
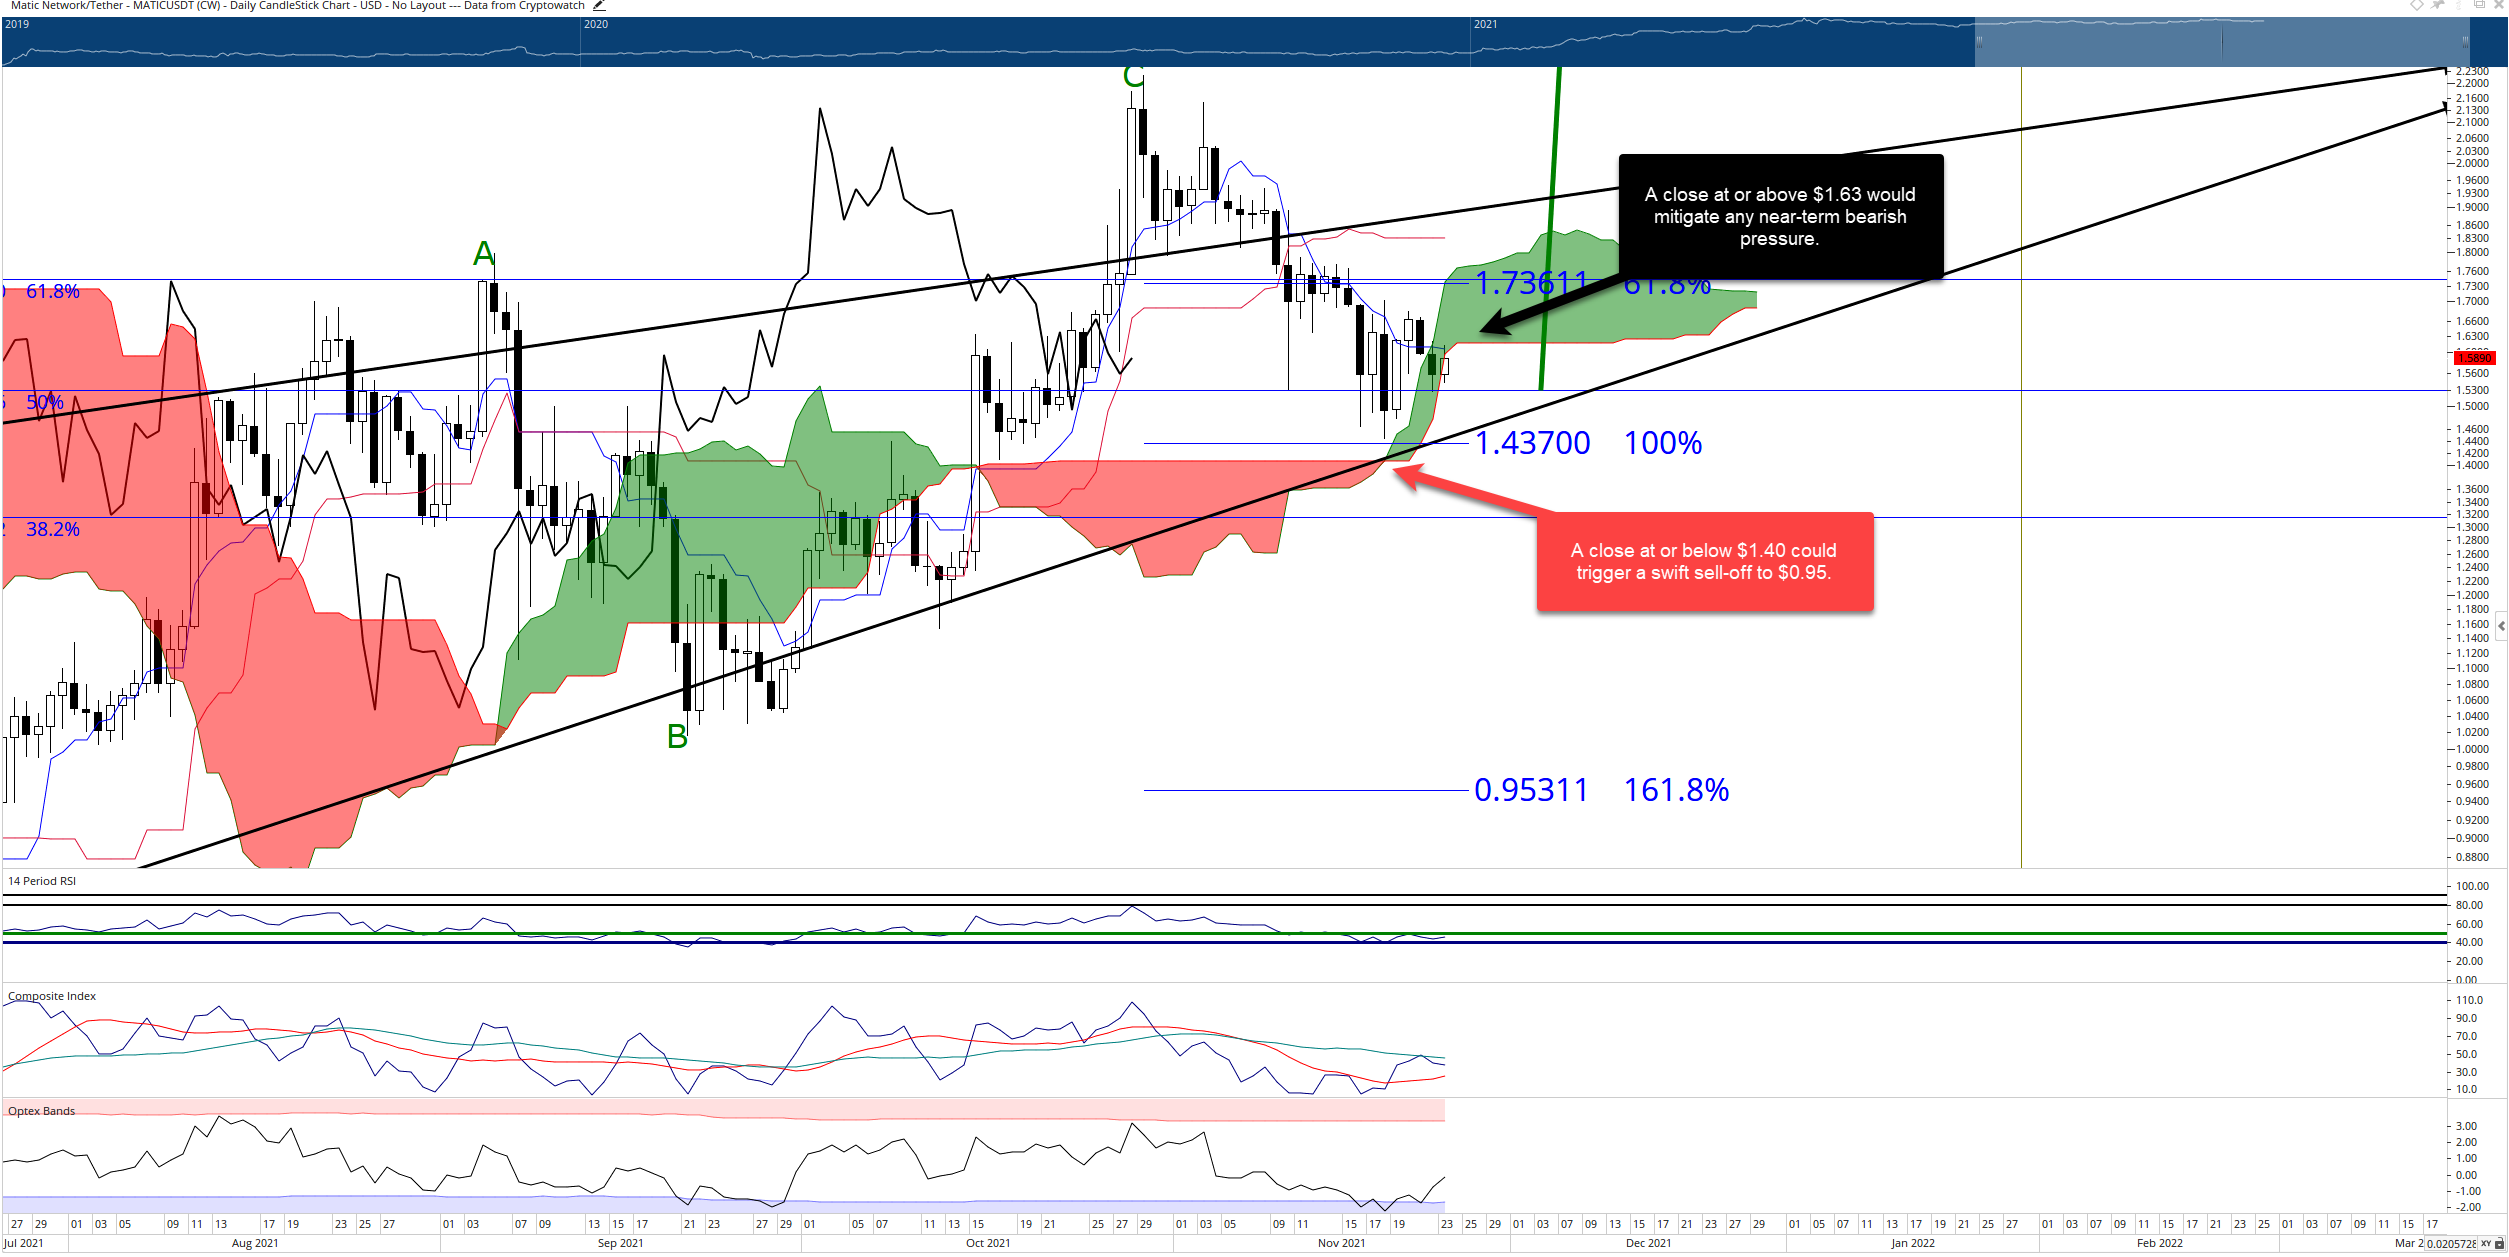
MATIC/USDT Daily Ichimoku Chart
The near-term bearish outlook could be mitigated if MATIC price closes above the Tenkan-Sen and Senkou Span B at $1.63. From there, the road to the Point and Figure buy stop entry is more straightforward and more probable.


