
- MATIC price shows a massive buying pressure that has propelled it to fresh highs at $2.18.
- Although a decisive close above the 127.2% Fibonacci extension level at $2.19 could propel Polygon higher, it is unlikely.
- A retracement to $1.89 or $1.65 seems plausible, considering the recent ascent.
MATC price shows a bullish bias that has catapulted it to a record level. If the buyers continue to pile up the bid orders, Polygon could slice through the immediate barrier and reenter price discovery mode. However, failure to do so could result in a retracement to the weekly lows.
MATIC price blasts off
MATIC price shows a 25% surge over the last 6 hours, which has pushed it to an all-time high at $2.18. If this momentum continues to build up, investors can expect Polygon to smash through the 127.2% Fibonacci extension level at $2.19.
However, it’s likely for MATIC price to begin retracing to $1.89, a 10% decline from the current price ($2.11). An early climb during the start of the week is usually followed by a sweep of the local lows, in this case $1.60.
While pullback to $1.60 is extreme, market participants can expect Polygon to at least retest or come close to the 78.6% Fibonacci retracement level at $1.65. Despite these drawdowns, MATIC price will remain bullish and eye a retest of $2.19. Slicing through this barrier will open up the Layer 2 scaling solution token’s path for a quick surge to the 141.4% extension at $2.35 or the 161.8% level at $2.58.
Adding credence to this short-term retracement is the Momentum Reversal Indicator’s (MRI) preemptive top signal flashed in the form of a yellow down arrow on the 3-day chart. This indication reveals that if the ascent continues, a reversal signal in the form of a red ‘one’ candlestick will be spawned. Such a technical formation forecasts a one-to-four candlestick correction.
Therefore, investors need to be cautious of the developments on the 3-day chart and how they could affect the short-term scenario. Either way, MATIC price seems primed for a minor downswing before it shoots up to a new high.
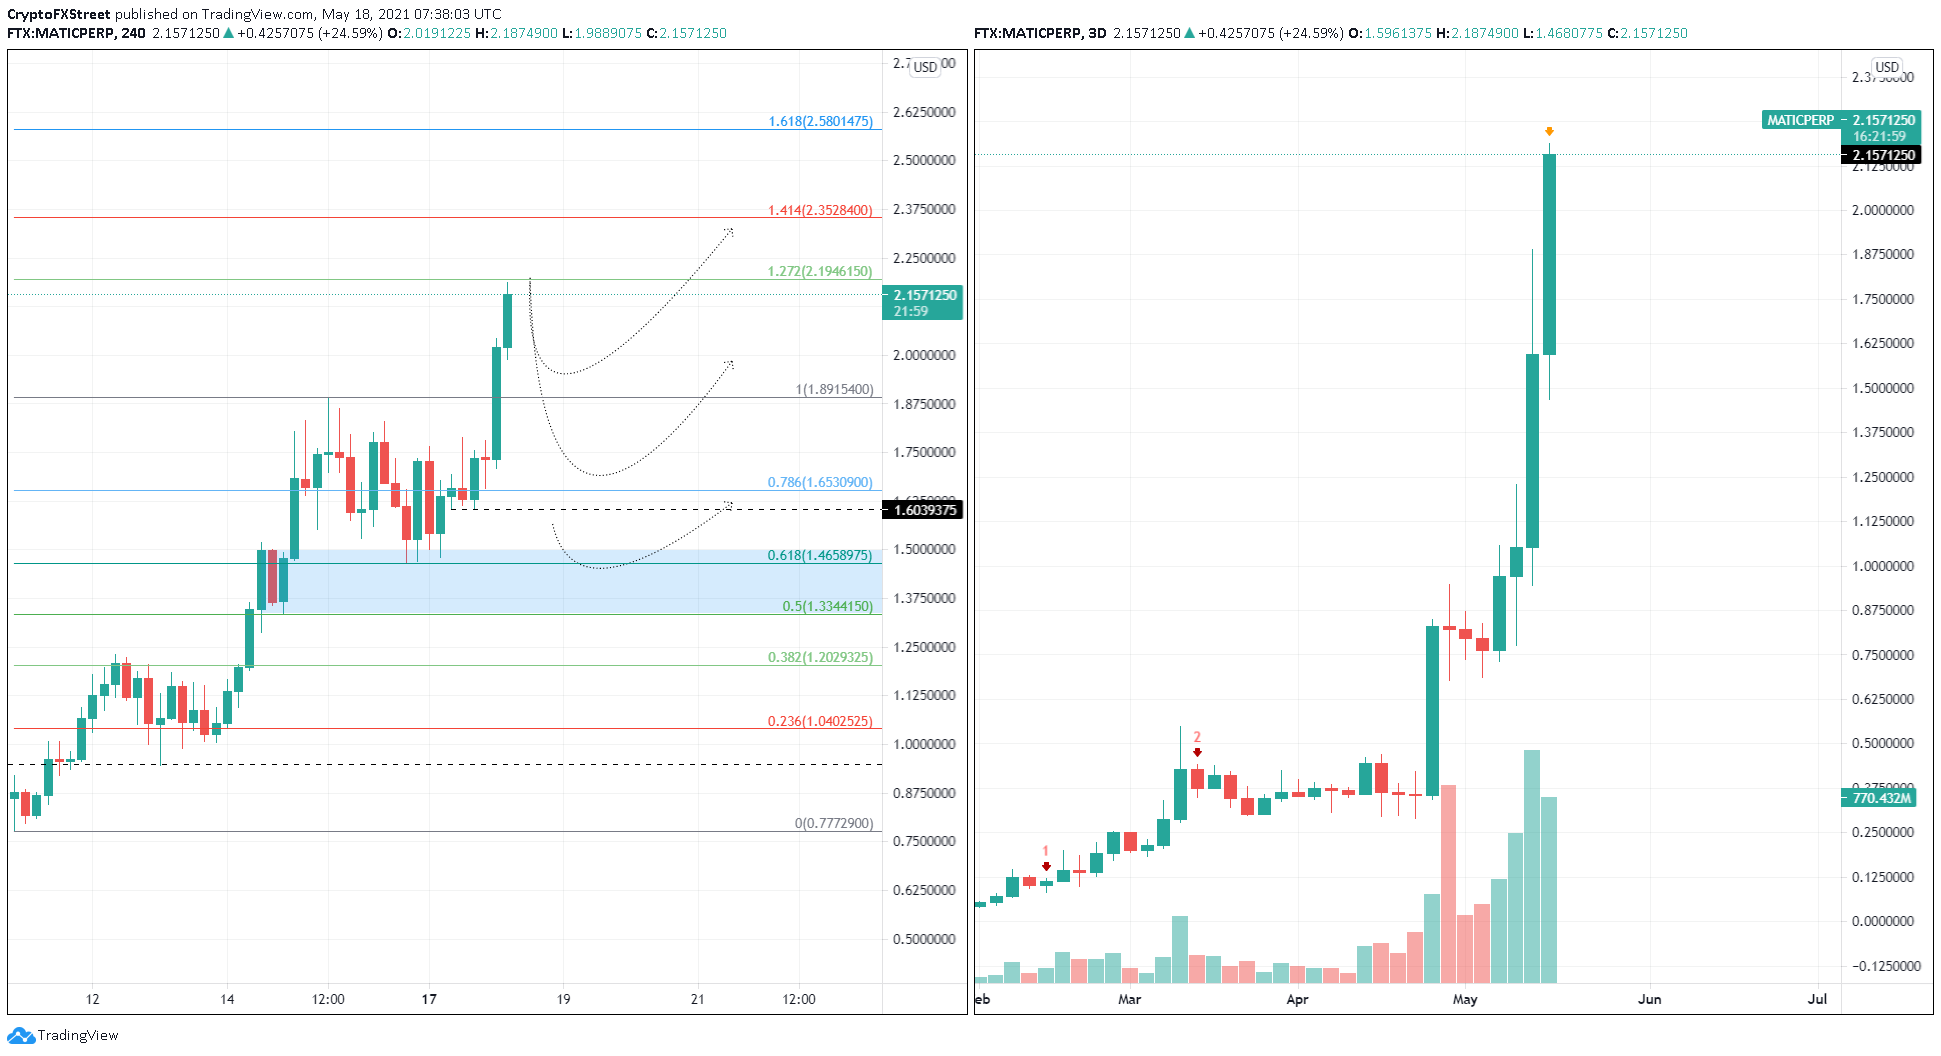
MATC/USDT 4-hour chart
If MATIC price slices through the 61.8% Fibonacci retracement level at $1.47, the upswing narrative will be in jeopardy. A decisive 4-hour candlestick close below $1.33, followed by sustained trading below this region, will invalidate the bullish outlook and kick-start a 10% sell-off to $1.20.


