
- MATIC price regains bullish groove with a 29% gain, besting most cryptocurrencies.
- Polygon volume profile finally reveals accumulation yesterday, with daily volume coming in at 3x the daily average.
- 200-day simple moving average (SMA) serves as a springboard as prominent investors accumulate digital assets.
MATIC price closed yesterday with the best gain since the 63% gain recorded on May 24, marking a trend reversal for the Indian blockchain. Moving forward, Polygon confronts three tactical resistance levels that may impede a quick follow-through on the dynamic rebound. In fact, buying on weakness may provide the best approach to participating in a new advance.
MATIC price consolidates the bullish turn making patience imperative
MATIC price exploded onto the scene again with a headlining gain of 29%, pushing near the top of the cryptocurrency complex list of top performers. It was a loud rebuttal to the -40% decline that had dominated price action since the breakdown from the symmetrical triangle pattern on July 12. Nevertheless, Polygon is only up 10% for the week and is still down -25% in July, emphasizing the recent challenges for market speculators.
The MATIC price event was notable but what induces a renewed conviction in the Polygon story is the commitment and emotion displayed by investors, as it was the first positive day on above-average volume since the May 26 gain of 14%. The robustness of the bid reveals the engagement of prominent and institutional investors at the strategically important 200-day SMA at $0.66.
Yesterday’s rebound struck resistance at the June 22 low of $0.92, as well as today. It is one of three technical challenges that await eager Polygon market operators. The second resistance point is the symmetrical triangle’s apex at $1.06, followed by the 50-day SMA at $1.18. A rally above the moving average puts MATIC price on a path to the June 15 high of $1.75 and an 85% gain from the current price.
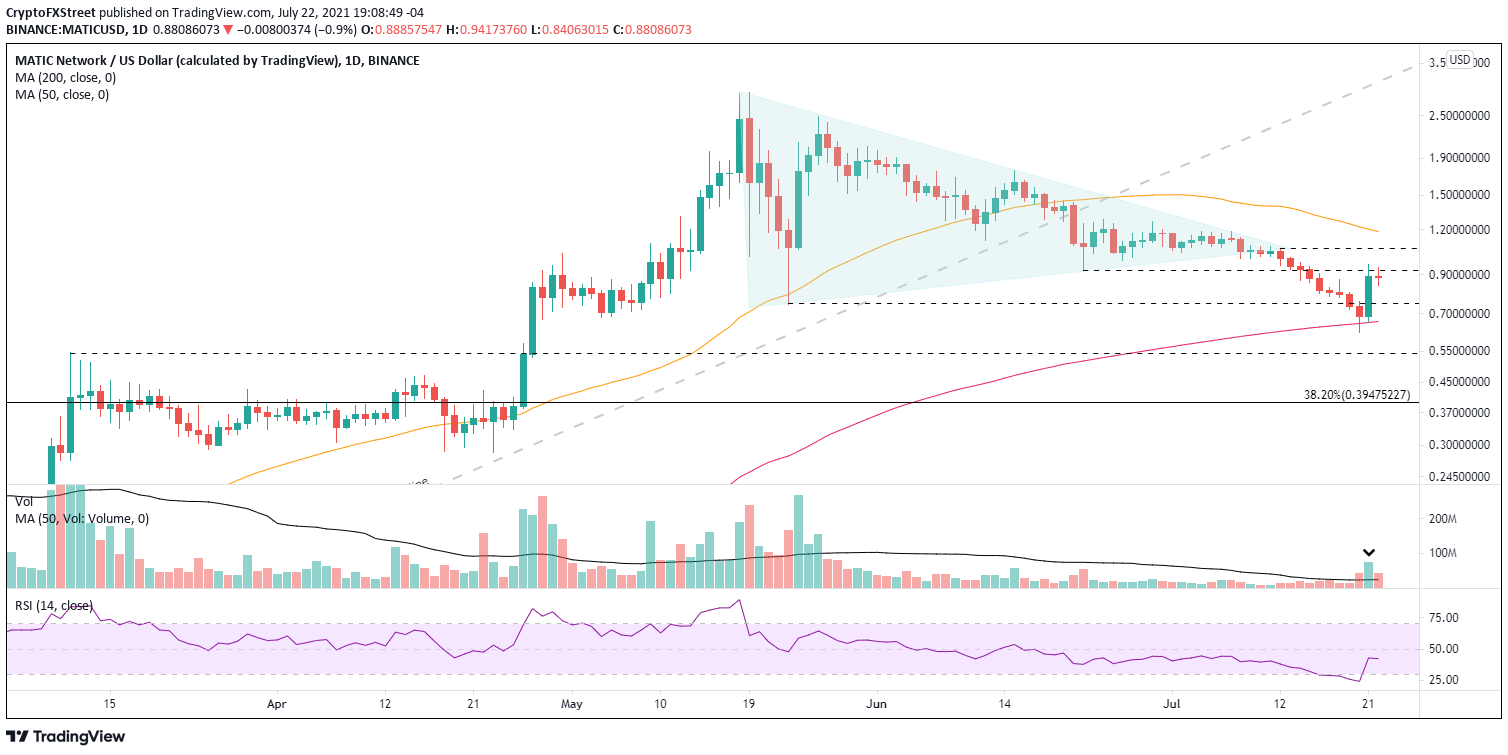
MATIC/USD daily chart
If there is an eagerness to be involved with Polygon, it is recommended to use a trade above yesterday’s high of $0.95 to trigger accumulation. The recommendation is based on the constructive MATIC price action since the rebound high, showing no selling on the intra-day charts as it constructs a pennant pattern.
A more profitable alternative is to allow MATIC price to correct some of the rebound and use the weakness to build a position. Levels of interest include the 50 four-hour SMA at $0.82 and the May 23 low at $0.74.
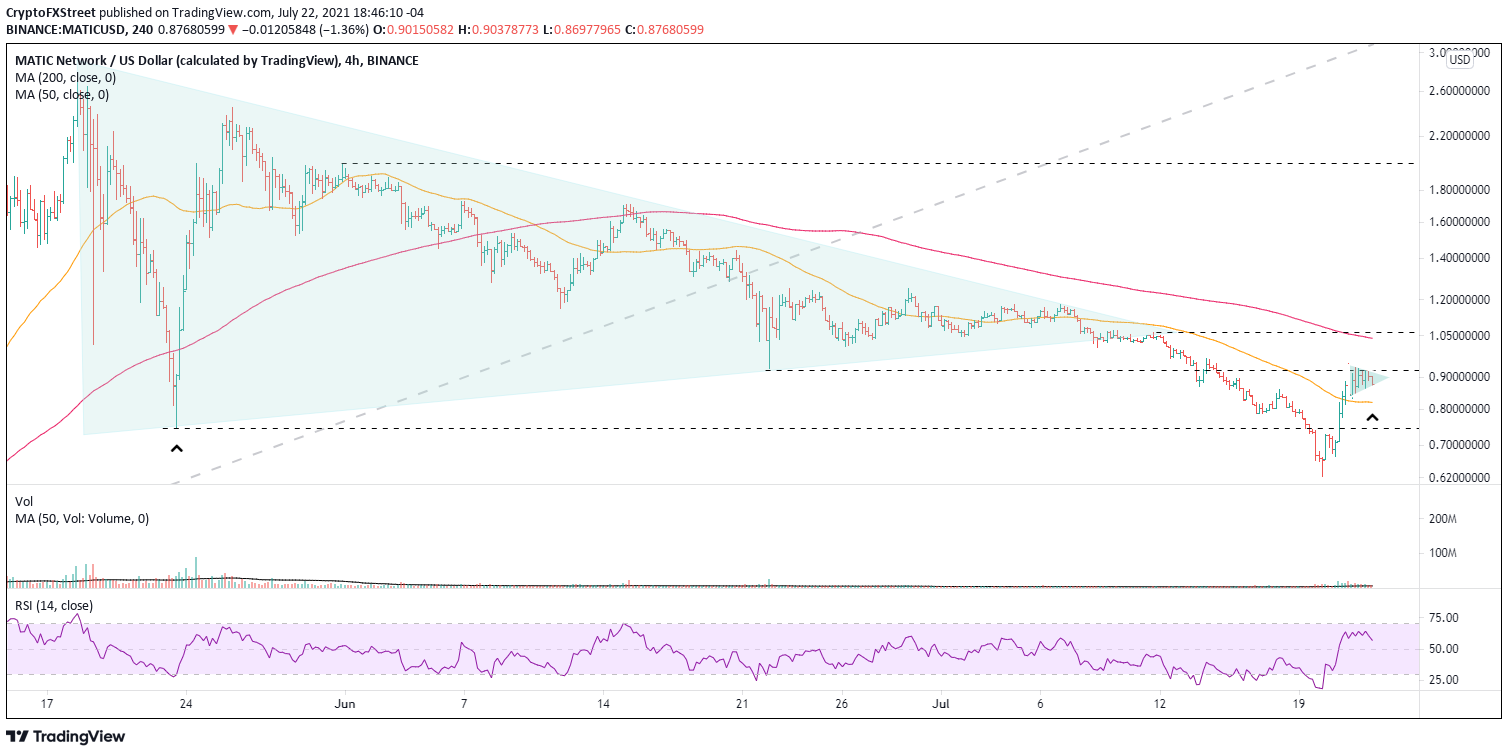
MATIC/USD 4-hour chart
If a MATIC price pullback accelerates into sell-off, the 200-day SMA is the critical support level on a daily closing basis. A close below the moving average raises the probabilities of the correction continuing, putting Polygon at risk of testing the March 11 high of $0.54 or, potentially, the 38.2% Fibonacci retracement of the 2021 advance at $0.39.
The constructive price action on the intra-day charts supplemented by the commitment and emotion behind the 29% gain tilts the outlook bullish. To participate, buying on weakness is the preferred option, but bullish opportunities usually emerge when momentum transforms into a pennant formation, as with MATIC price. Either way, there is impressive upside potential for Polygon investors.
Here, FXStreet's analysts evaluate where Polygon could be heading next.


