
- NZD/USD fails to carry the bounce off intraday low.
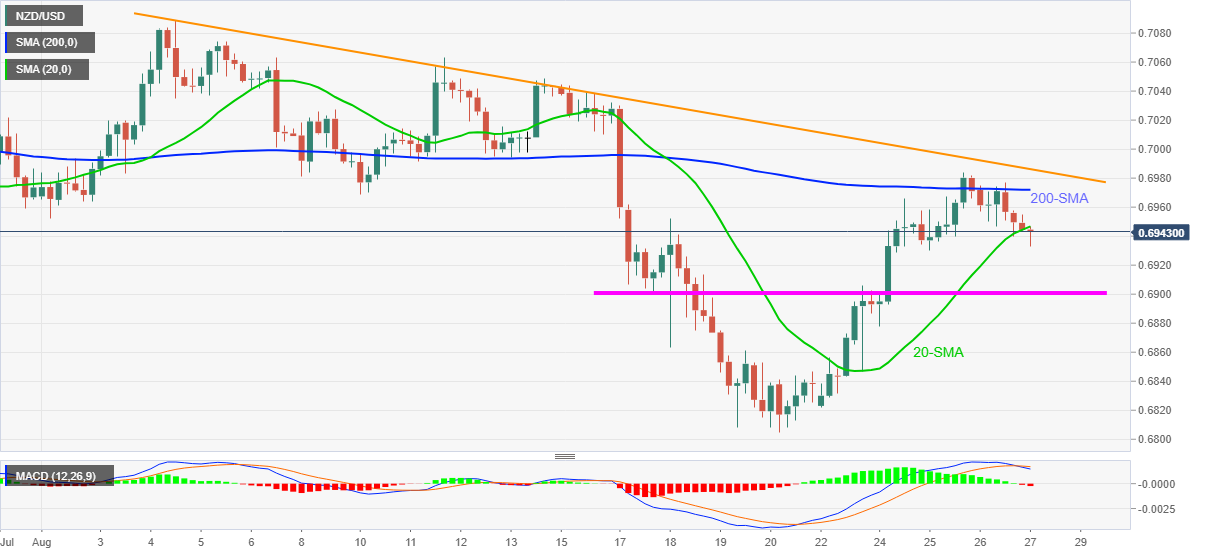
- 20-SMA guards immediate recovery as MACD turns most bearish in a week.
- 200-SMA, descending trend line from August 04 add to the upside filters.
- Eight-day-old horizontal area lures short-term sellers before the monthly low.
NZD/USD fades corrective pullback from intraday low while retreating to 0.6940, down 0.10% on a day during early Friday. In doing so, the kiwi pair drops for the second consecutive day following its failure to cross 200-SMA.
That said, the quote’s recent weakness could be linked to the break of 20-SMA and MACD signals suggesting extended fall towards a horizontal area comprising multiple levels marked since August 17, around 0.6900.
In a case where the NZD/USD bears keep reins past 0.6900, multiple levels can challenge them between 0.6850 and 0.6840 before directing towards the yearly low of 0.6805.
Meanwhile, an upside clearance of the 20-SMA level of 0.6950 will back another battle with the 200-SMA level of 0.6972.
Even if the NZD/USD buyers manage to cross 0.6972, a multi-day-old falling resistance line near 0.6985 and the 0.7000 psychological magnet will be the tough nuts to crack for them.
NZD/USD: Four-hour chart
Trend: Further weakness expected


