
- NZD/USD has completed a 61.8% Fibo on the daily chart.
- Weekly resistance could be the catalyst for a downside extension.
NZD/USD bulls are in charge but could be heading into the bear's layer at this juncture.
The following illustrates the bearish bias from a market structure basis.
Monthly chart
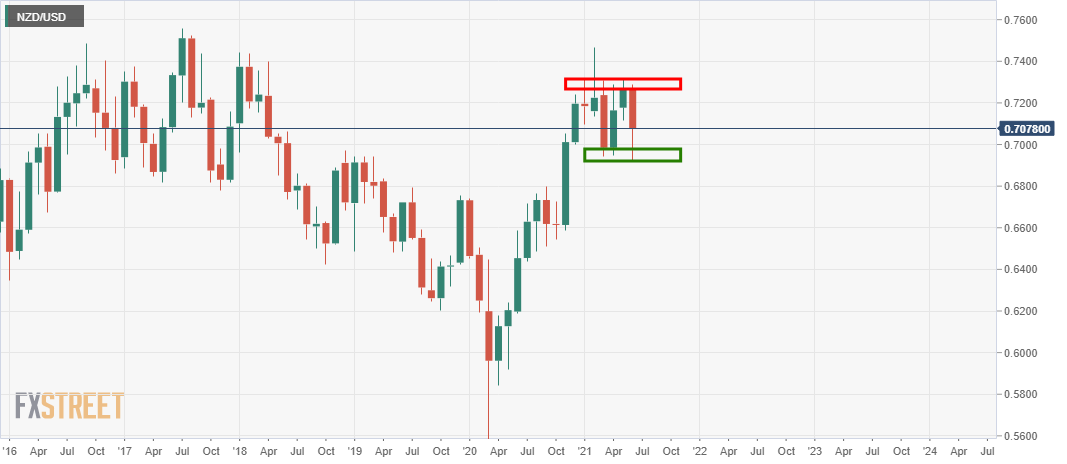
The bird is caught in between a monthly resistance and support structure, moving sideways with no clear bias either way.
0.6924 marks the downside while 0.7320 is an important upside level.
Weekly chart
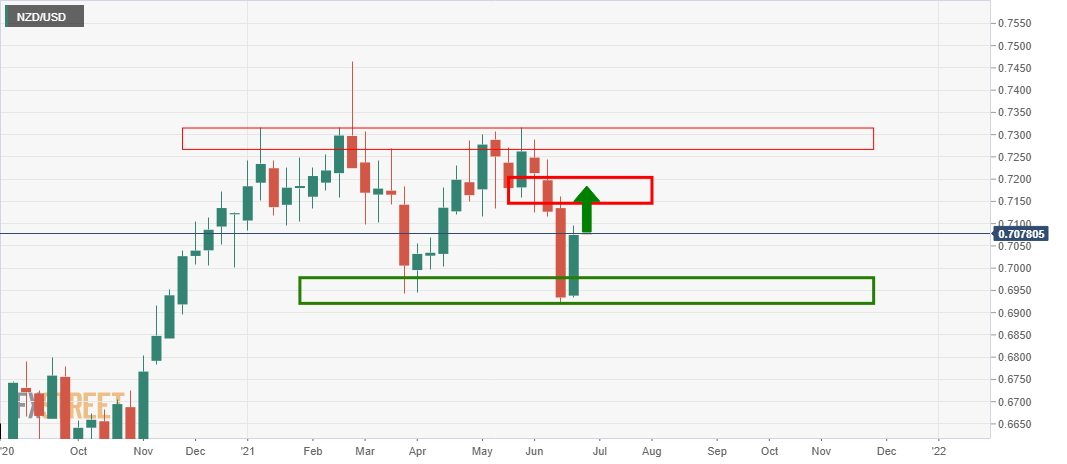
The weekly chart has the price on the approach for a deeper test of the prior support and what would now be expected to be a weekly resistance at 0.7150.
Daily chart
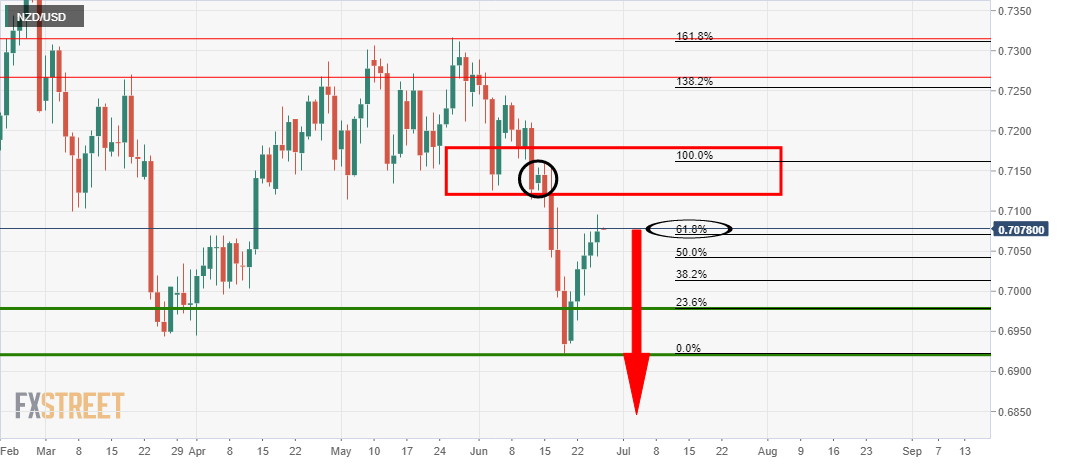
The bulls are indeed on the move and have met a 61.8% Fibonacci retracement of the prior bearish impulse.
There is, however, the prospect of a test of the prior support higher up near 0.7130.
Whether it be here or there, the market could well reverse at this juncture and provide a downside opportunity in an extension of the bearish impulse.
With that being said, if these structures are broken to the upside, then the bulls will be back in play.


