
- NZD/USD fades bounce off intraday low, keeps previous day’s pullback from weekly top.
- Bullish chart pattern, failures to conquer 200-HMA favor buyers.
- One-week-old horizontal support adds to the downside filters.
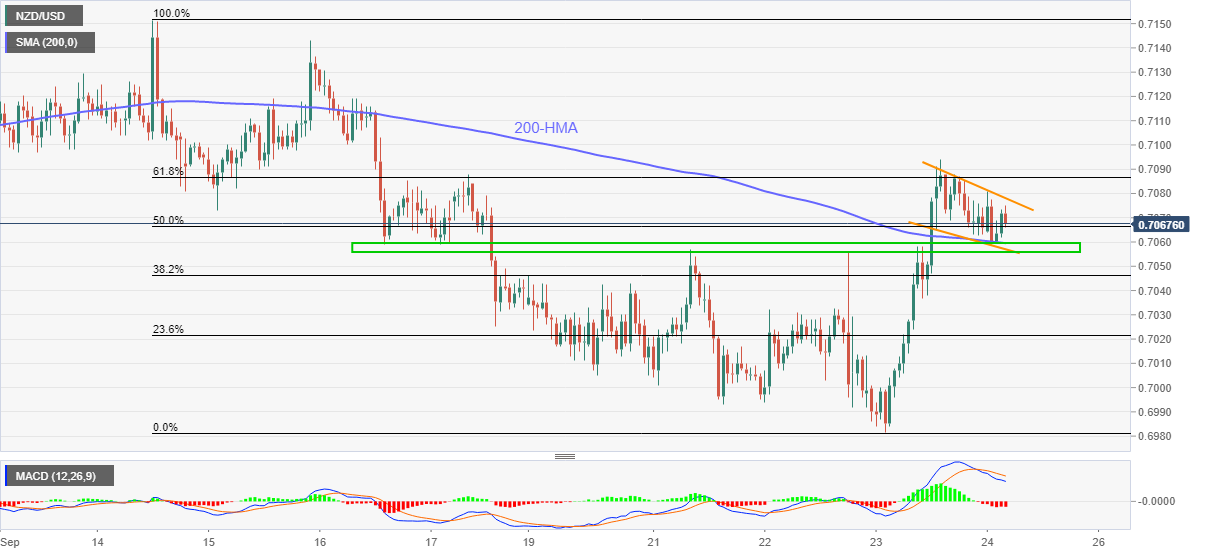
NZD/USD remains directionless, recently easing to 0.7067 ahead of Friday’s European session.
The kiwi pair refreshed weekly top the previous day before stepping back from 0.7094. However, the pullback moves remain above 200-HMA.
With that, the quote portrays a bullish flag on the hourly chart, which in turn signifies 0.7080 as the key upside hurdle.
Following that, the NZD/USD rally towards the mid-month top near 0.7150 can’t be ruled out. However, the latest high near 0.7100 may test the bulls before the run-up.
Meanwhile, the 200-HMA, support line of the stated flag and an area comprising multiple levels marked since September 16, around 0.7060-55, restricts the short-term NZD/USD declines.
Should the quote drops below 0.7050, the 0.7000 threshold may offer an intermediate halt during the fall targeting the monthly low near 0.6980.
NZD/USD: Hourly chart
Trend: Recovery expected


