
- NZD/USD drops from the convergence of the key SMA and 23.6% Fibonacci retracement of November-December fall.
- China CPI, PPI dropped below market consensus and forecasts in December.
- Pullback remains elusive beyond five-week-old horizontal support.
NZD/USD struggles to extend the previous day’s run-up, easing to 0.6780 amid Wednesday’s Asian session.
The kiwi pair’s latest pullback could be linked to the downbeat inflation data from New Zealand’s key customer China. That said, the headline Consumer Price Index (CPI) eased below 1.8% forecast and 2.3% prior to 1.5% YoY while the MoM readings also dropped to -0.3% compared to +0.2% expected and +0.4% previous readouts. Additionally, the factory-gate inflation, namely the Producer Price Index (PPI) also retreated below 11.1% expected and 12.9% prior, to 10.3% YoY for December.
Read: China CPI misses the mark, AUD unchanged on the outcome, so far
In addition to the downside China data, a confluence of 23.6% Fibonacci retracement, 100-SMA and 200-SMA, around 0.6790-95, also challenged the NZD/USD bulls.
While softer data and a failure to cross the key hurdle signals the pair’s further weakness, a horizontal area established from December 07, near 0.6735-30, becomes the key hurdle for NZD/USD bears.
Following that, the 2021 bottom near 0.6700 and the 61.8% Fibonacci Expansion (FE) of the pair’s moves between November 15 and December 24, around 0.6650, will lure the NZD/USD sellers.
Alternatively, a horizontal area comprising multiple levels marked since September, around 0.6855-60 becomes an additional important resistance to watch for the pair buyers even if they manage to overcome the 0.6795 hurdle.
NZD/USD: Four-hour chart
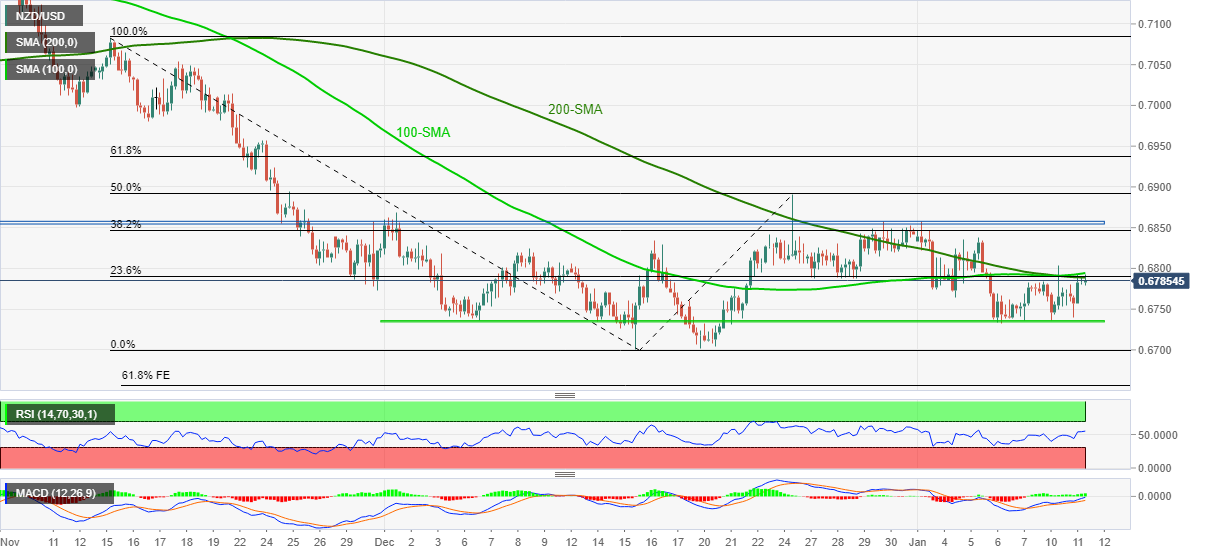
Trend: Pullback expected


