
- NZD/USD fades Thursday’s recovery moves below 200-HMA, monthly resistance line.
- Weekly horizontal support tests sellers amid sturdy RSI.
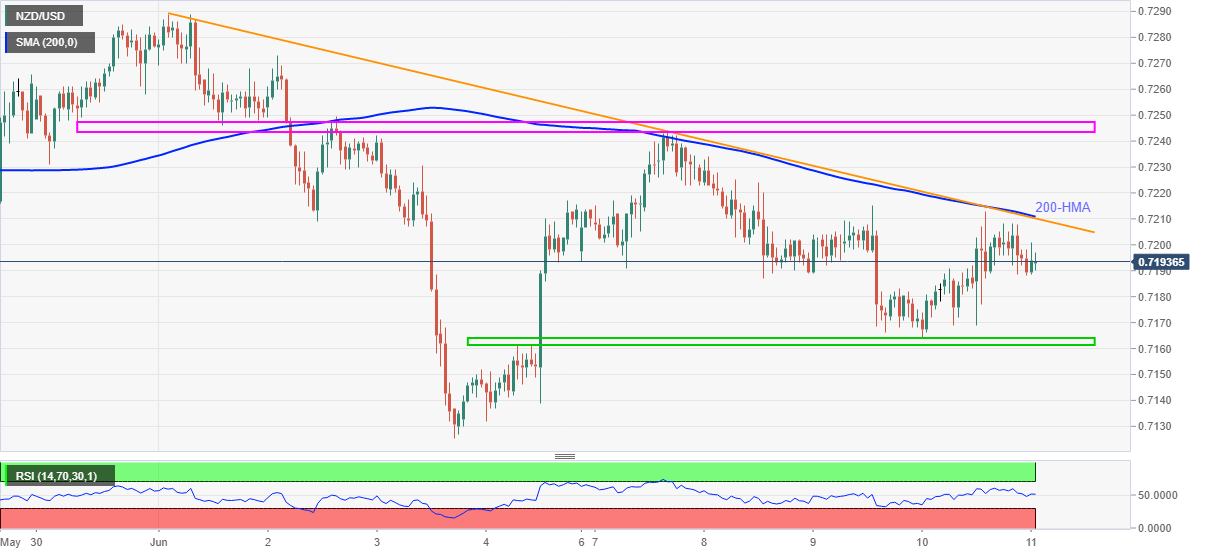
- 0.7245-50 area adds to the upside filters before the monthly top.
NZD/USD edges lower around 0.7190, down 0.15% intraday, amid Friday’s Asian session trading. The kiwi pair recovered from 0.7164 the previous day but couldn’t cross a convergence of 200-HMA and a downward sloping trend line from June 01.
Considering the sturdy RSI, the latest pullback moves seem doubtful to break the 0.7165-60 horizontal support area. Also likely to challenge the NZD/USD sellers is the monthly low of 0.7125.
It’s worth noting that a clear downside break of 0.7125 will make the kiwi pair drop further towards May’s low near 0.7115 and then to the 0.7100 threshold.
On the flip side, a clear break of 0.7210 resistance confluence isn’t a free pass to the NZD/USD buyers as a horizontal area established since May 31, around 0.7245-50 acts as an extra hurdle to the north.
Overall, NZD/USD remains sideways between 0.7160 and 0.7250.
NZD/USD hourly chart
Trend: Pullback expected


