
- NZD/USD bears take a breather following the biggest daily fall in a week.
- Short-term SMAs stop bears on the way to weekly horizontal support comprising multi-month low.
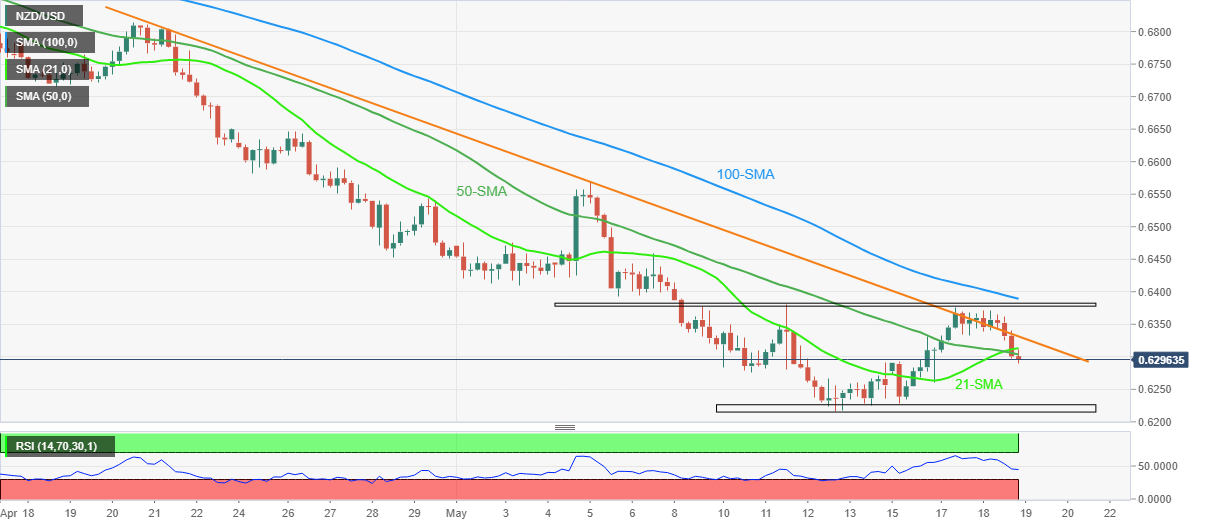
- Descending RSI, not oversold, keep sellers hopeful, 100-SMA limits upside momentum.
NZD/USD holds lower ground near 0.6300, after declining the most in a week, as bears await the key New Zealand Annual Budget Release during early Thursday.
In doing so, the Kiwi pair jostles with the 21-SMA and 50-SMA amid a downward sloping RSI (14) line, not oversold.
Not only the RSI but the pair’s inability to cross one-week-old horizontal resistance, as well as stay beyond a monthly descending trend line also keeps NZD/USD sellers hopeful.
That said, the quote’s latest weakness aims the area comprising the monthly low, also the lowest levels since 2020, around 0.6225-15.
Following that, the 0.6200 threshold may offer an intermediate halt before directing bears towards April 2020 peak near 0.6175.
Alternatively, a one-month-old downward sloping resistance line restricts immediate upside around 0.6335, a break of which will direct buyers towards a horizontal region from May 09, surrounding 0.6375-85.
Even if the NZD/USD prices rise past 0.6385, a clear run-up past-100-SMA, close to 0.6390, becomes necessary for the buyers to retake control.
NZD/USD: Four-hour chart
Trend: Further weakness expected


