
- NZD/USD remains pressured inside a bearish chart pattern on 1H.
- Sustained trading below 50-HMA, 200-HMA adds strength to downside bias.
- March-end tops lure sellers, three-week-old resistance line offers extra filters to north.
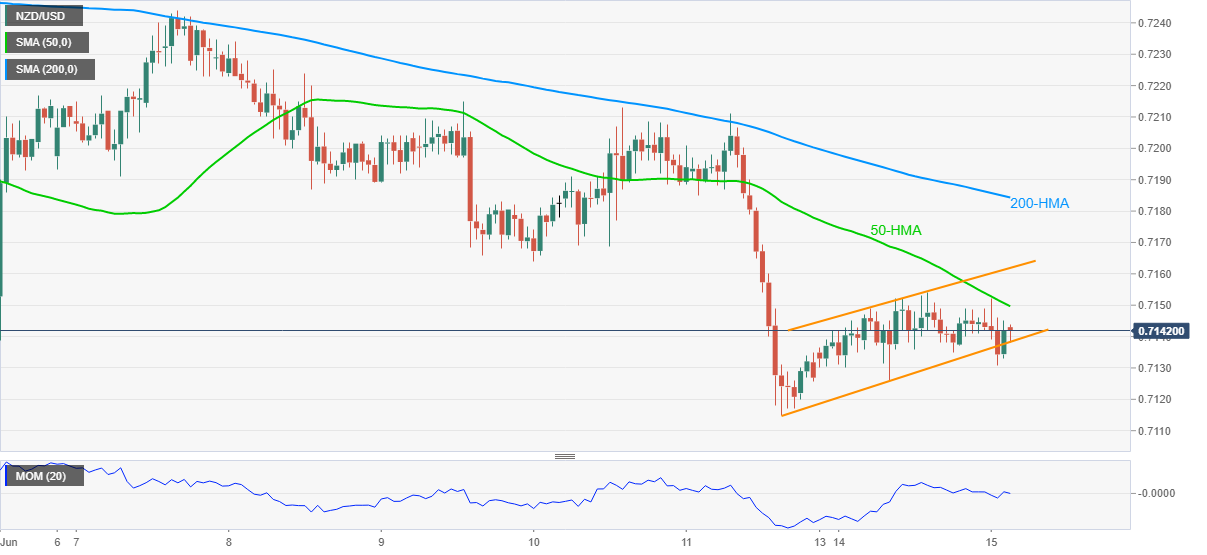
NZD/USD edges lower around 0.7140, down 0.04% intraday, amid early Tuesday. In doing so, the kiwi pair portrays a bearish flag chart pattern on the hourly (1H) play while staying below key Hourly Moving Averages (HMAs).
Considering the Momentum retreat, NZD/USD sellers are likely to keep the reins. However, a clear downside break of 0.7130 becomes necessary for them before targeting the theoretical target of near 0.7025-30, surrounding late March levels.
During the fall, lows marked during May and the monthly bottom around 0.7115 acts as the key hurdle for the bears.
On the flip side, the 50-HMA level of 0.7150 acts as an immediate resistance ahead of the flag’s upper line close to 0.7160.
It’s worth noting that the quote’s run-up beyond 0.7160 isn’t a free pass to the NZD/USD bulls as 200-HMA, close to 0.7184, followed by a downward sloping trend line from late May near 0.7195, will test the further upside.
NZD/USD hourly chart
Trend: Bearish


