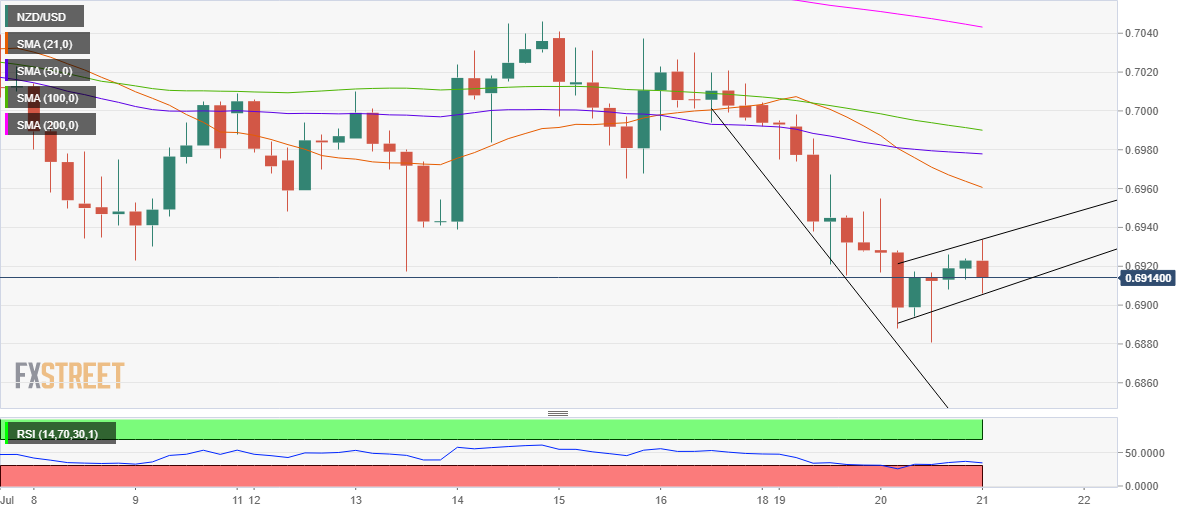
- NZD/USD displays a bear flag on the four-hour chart.
- Risk-off mood-led DXY strength keeps sellers hopeful.
- RSI points south below the midline, allowing more declines.
NZD/USD is meandering near daily lows just above 0.6900, almost unchanged on the day, as the bears await a strong catalyst for the next move lower.
The return of risk-off trading in Asia, amid mounting concerns over the Delta covid strain cases and worries of economic slowdown once again, lifts the safe-haven demand for the US dollar at the expense of the risk-sensitive kiwi.
The Kiwi was the weakest across the G10 currencies on Tuesday, despite markets witnessing a brief turnaround. At the press time, the spot is trading at 0.6913, having hit daily lows at 0.6907.
Looking at it technically, the recent sell-off that followed a brief consolidative stint so far this Wednesday has taken the shape of a bear flag.
Bears now await a fresh impetus to yield a downside breakout of the bearish flag, by beating bullish commitments at 0.6905.
Sellers would then target the multi-month lows of 0.6881, below which the 0.6850 psychological level could come into play.
A sustained break above the rising trendline resistance at 0.6933 will invalidate the bearish formation, unleashing a meaningful recovery towards the downward-sloping 21-Simple Moving Average (SMA) at 0.6960.
However, the Relative Strength Index (RSI) pointing south while just above the oversold region, suggests that a potential downswing could be in the offing.
NZD/USD four-hour chart