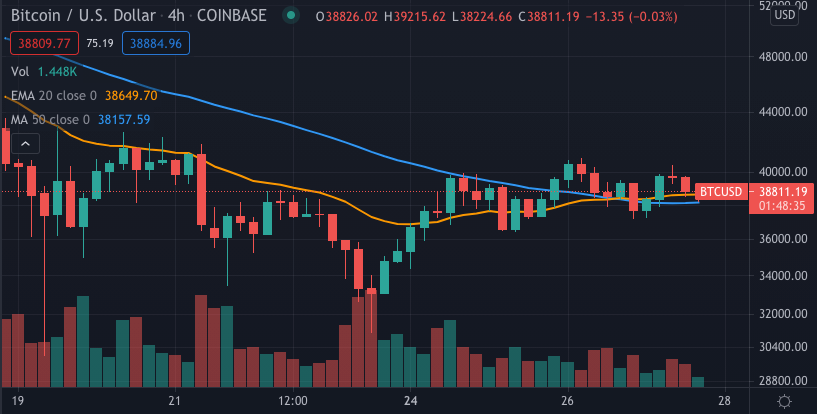
Crypto markets have recovered slightly this week, following a drop of over $1 trillion in the aggregate market capitalization of all crypto-assets. As the negative news surrounding Elon Musk and China slows down, the markets have remained range-bound with Bitcoin trading between $33,000 and $41,000 for the most part.
The recent price action has left many traders wondering what may come next for Bitcoin and crypto broadly. By diving into on-chain and derivatives market data, we are able to obtain key insights to assess the near future of Bitcoin.

Source: TradingView
Addresses’ profitability directly impacts buy and sell orders set by investors. Using on-chain data, IntoTheBlock’s In/Out of the Money Around Price (IOMAP) groups clusters of addresses depending on whether they are profitable (in the money) or losing money (out of the money), at least on paper.
The largest clusters of addresses represent at which price the most volume of Bitcoin had previously been bought, and directly influences near-term support and resistance levels.
-637581265072865421.png)
As of May 27 through IntoTheBlock’s Bitcoin financial indicators
The IOMAP reveals that 760k addresses had previously bought approximately 480k Bitcoin at a price around $38,000. Due to the large buying activity around this area, as well as slightly below ($36,700 to $37,851), there is expected to be strong support from new buyers and current holders. Were this level to fail, then a drop to $34,000 is likely.
On the other hand, there is strong resistance at $40,000. The high amount of volume that was previously bought there is expected to create selling pressure as many holders tend to look to sell positions at a break-even level. Moreover, if buyers are able to get Bitcoin beyond this range, a move to $43,000 seems probable as there appears to be little resistance in between.
Due to the high concentration of volume currently near price, it is likely that price may continue range-bound, unless there is a major catalyst in either direction.
By looking at the variations in profitability, we are also able to examine the buying/selling activity taking place. The Historical In/Out of the Money (HIOM) does just this, breaking down the number of addresses profiting over time.
-637581266160719620.png)
As of May 27 through IntoTheBlock’s Bitcoin financial indicators
Comparing Bitcoin versus a week ago when it traded at a similar level we observe two interesting patterns. First, the number of addresses in the money is 800k greater, even though the price is roughly the same. This points to a large number of holders taking the crash to $30,000 as an opportunity to buy and lower their average costs, thus making them profitable as prices rebounded.
Second, the number of addresses out of the money decreased by over one million. Though some of these averaged down their entry price, it is also likely that many panic sold, realizing their losses and no longer being considered by the HIOM.
Signs of panic and extended selling also showed in derivatives markets. Perpetual swaps’ funding rate reached negative levels for the first time all year in the largest three derivatives exchanges.
-637581266699859007.png)
As of May 27 through IntoTheBlock’s Bitcoin derivatives indicators
For those unfamiliar with perpetual swaps, the funding rate is a fee charged to long or short contract holders depending on whether the “perp” is at a premium/discount relative to spot prices. If the funding rate is positive, long holders have to pay short holders the funding fee, thus creating market forces to incentivize the reduction of the premium. The opposite is also true.
In the past week, the funding rate reached negative levels twice, pointing to Bitcoin perpetual swaps being heavily shorted as markets crashed. This pattern also emerged in the March 12 crash as traders got overly bearish. While this alone does not guarantee a reversal, it does point to overextended selling activity.
Overall, Bitcoin has recovered from the severe correction as panic from the crash eases and buying activity picks up. On-chain data points to Bitcoin trading between two points of large support and resistance. In order to restart the move up, Bitcoin traders will first have to overcome strong resistance at $40,000 and $43,000.


