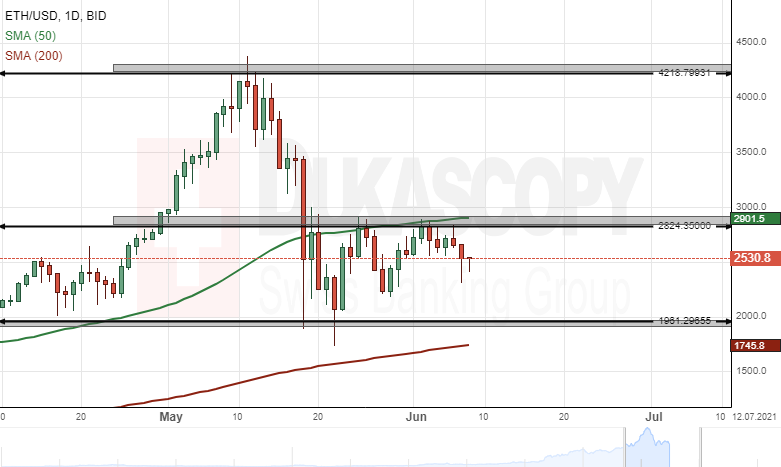
BTC/USD daily 4H chart: Consolidates below $40,000
The Bitcoin cryptocurrency has been consolidating below the $40,000 level since the middle of May.
The world's largest crypto by market capitalization, declined by 10% during last week's trading sessions.
Technical indicators suggest selling signals on the 4H, daily and weekly time-frame charts. Most likely, sellers could continue to pressure the BTC/USD pair lower during the following trading sessions.
On the other hand, the Bitcoin versus the USDT could continue to trade within the $30,000/$40,000 range during next week's sessions.
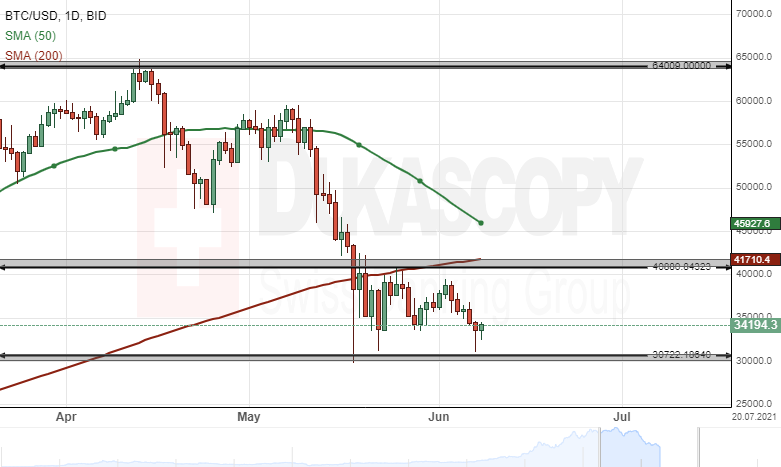
ETH/USD daily chart: Fails to surpass 50-day SMA
The Etheruem cryptocurrency edged higher by 28.93% against the US Dollar during last week's trading sessions. The surge was stopped by the 50– day simple moving average.
The second-largest cryptocurrency by market capitalization failed to surpass the 50– day SMA.
Technical indicators suggest selling signals on the 4H time-frame chart. The exchange rate could continue to edge lower this week.
However, sellers are likely to encounter support at the $2,000 level during the following trading sessions.