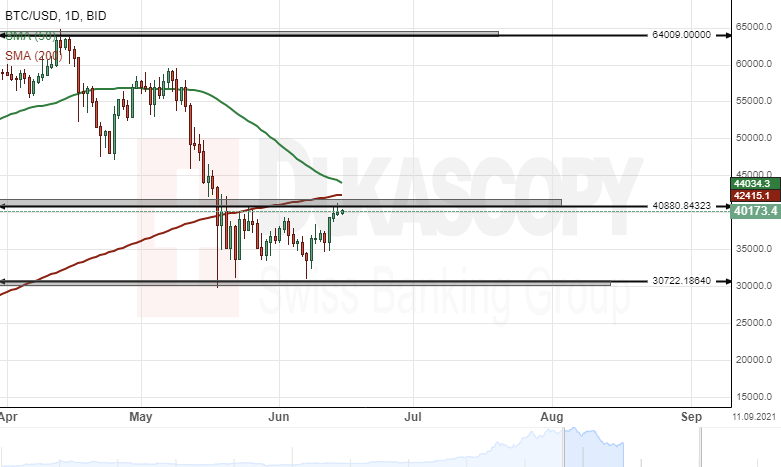
BTC/USD daily chart: Hits three
The Bitcoin cryptocurrency has edged higher by 24.81% against the US Dollar since June 11. The exchange rate tested a three-week high at $40,800 during this week's trading sessions.
Technical indicators suggest buying signals on the 4H time-frame chart. Most likely, the world's largest crypto by market capitalization could continue to trend bullish during the following trading sessions.
However, bullish traders might encounter a resistance cluster near the $41,000 mark during this week's trading sessions.
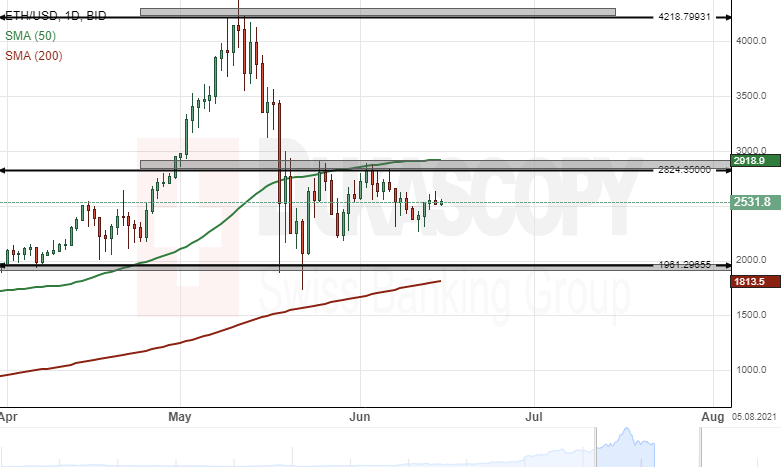
ETH/USD daily chart: Consolidates below $3,000
The Ethereum cryptocurrency declined by 17.99% against the US Dollar during last week's trading sessions. The 50– day simple moving average pressured the exchange rate lower last week.
The cryptocurrency Ether could continue to trade within the 2,000.0/3,000.0 levels during the following trading sessions. Sellers are likely to target the $2000 level this week.
However, technical indicators suggest the ETH/USD cryptocurrency exchange rate could trend bullish during this week's trading sessions.