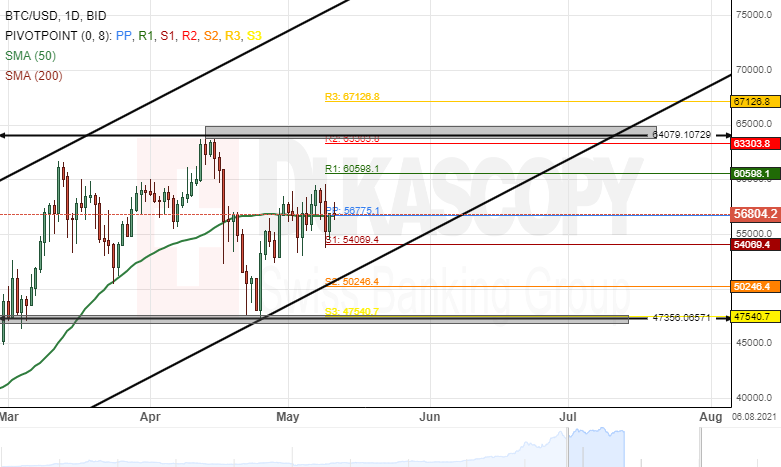
BTC/USD daily chart: Two scenarios likely
The Bitcoin cryptocurrency continued to trade below the $60,000 mark since last week's trading sessions.
Technical indicators suggest selling signals on the 4H time-frame chart. Most likely, bearish traders are likely to pressure the BTC/USD exchange rate lower during this week's trading sessions.
However, if the cryptocurrency exchange rate breaks the resistance level at the 65,000 area, buyers could target the $75,000 level in the next few weeks.
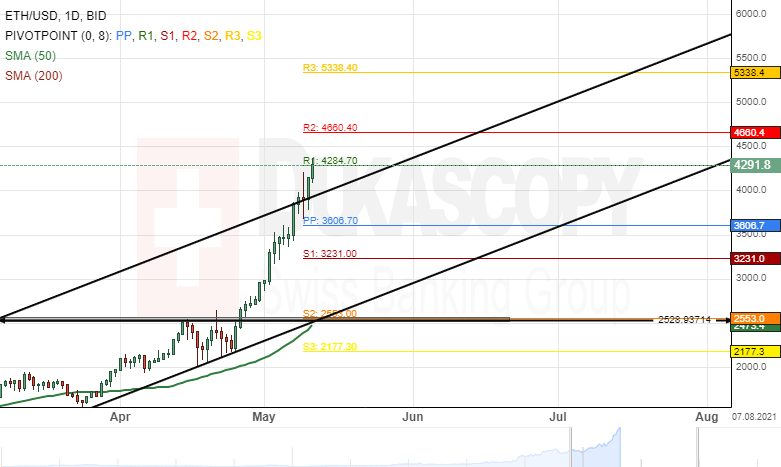
ETH/USD daily chart: Breaks $4000 mark
The Ethereum cryptocurrency has continued its bullish trend against the US Dollar. The second-largest cryptocurrency by market capitalization, surged past $4,000 to hit a new record high at $4300 this week.
Technical indicators suggest buying signals on the 4H, daily and weekly time-frame charts. Therefore, buyers may continue to push the cryptocurrency Ether higher in the next few weeks.
However, the ETH/USD exchange rate could make a pullback towards the $3500 mark in the shorter term.