
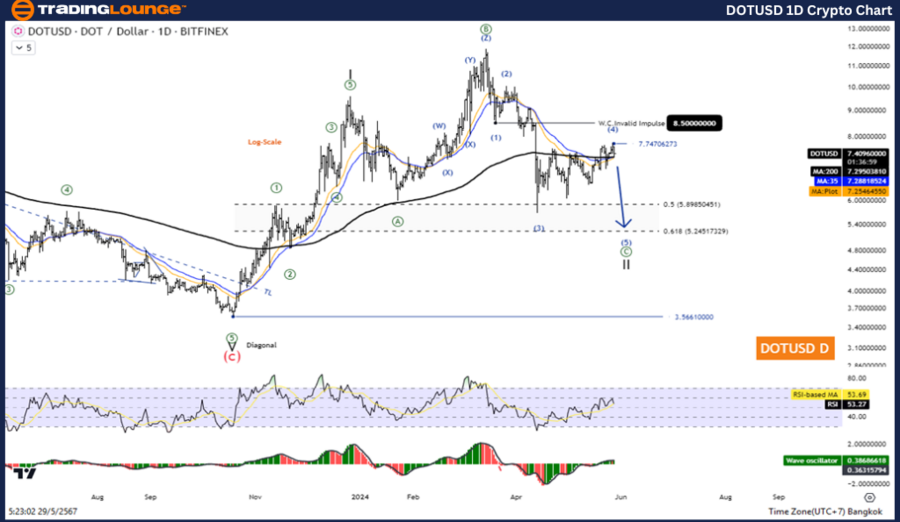
DOT/USD Elliott Wave technical analysis
Function: Counter trend.
Mode: Corrective.
Structure: Flat.
Position: Wave C.
Direction next higher degrees: Wave (II) of impulse.
Details: Wave II is equal to 61.8% of wave I at 5.225.
DOT/USD trading strategy
Overall, the correction in DOT/USD is entering its final phase in wave C, where it is likely to test the 5.245 level before rising again in wave 3, so wait for the correction to complete to join the downtrend. Up again.
DOT/USD technical indicators
The price is above the MA200 indicating an uptrend. The wave oscillator is a bullish momentum.
DOT/USD Elliott Wave technical analysis
Function: Follow trend.
Mode: Motive.
Structure: Impulse.
Position: Wave 4.
Direction next higher degrees: Wave C of flat.
Details: A short-term pullback in wave 4 before falling again in wave 5.
DOT/USD trading strategy
Overall, Dogecoin remains in an uptrend. Moreover, it looks like the correction is over. And prices are rising again in the fifth wave. But there may be a slight pullback before increasing. So look for opportunities to join the uptrend.
DOT/USD technical indicators
The price is above the MA200 indicating an uptrend, the wave oscillator is a bullish momentum.
.thumb-638525501246256843.png.81b584a92eae4db0f942d3611e067ef7-638525501246256843.png)


