
- Polkadot price poised for an explosive move higher.
- The projected profit target is more than double the present value area.
- Limited downside potential ahead.
Polkadot price continues to consolidate between the $26 and $31 price range. A breakout, however, is finally developing. The upside potential for DOT is substantial.
Polkadot price eyes a 178% rally to new all-time highs
Polkadot price action continues to respond, bullishly, to a Point and Figure chart pattern known as a Spike Pattern. A Spike Pattern is any column of Xs or Os with fifteen or more boxes. The entry is always on the 3-box reversal. The most recent reversal occurred on December 20 at $32, just above the present value area at $28.
The hypothetical long entry previously discussed is still valid and presents an opportunity to add to an existing position or open a new one. The entry is a buy stop order at $32, a stop loss at $24, and a profit target at $82. The projected profit target is derived from the Vertical Profit Target Method in Point and Figure Analysis.
The trade setup represents a 6.25:1 reward for the risk, with an implied gain of over 178% from the entry. Due to the range of the profit target from the entry, splitting this trade into three or four smaller trades could be appropriate. Additionally, a trailing stop(s) of two to three boxes would protect any post-entry profit.
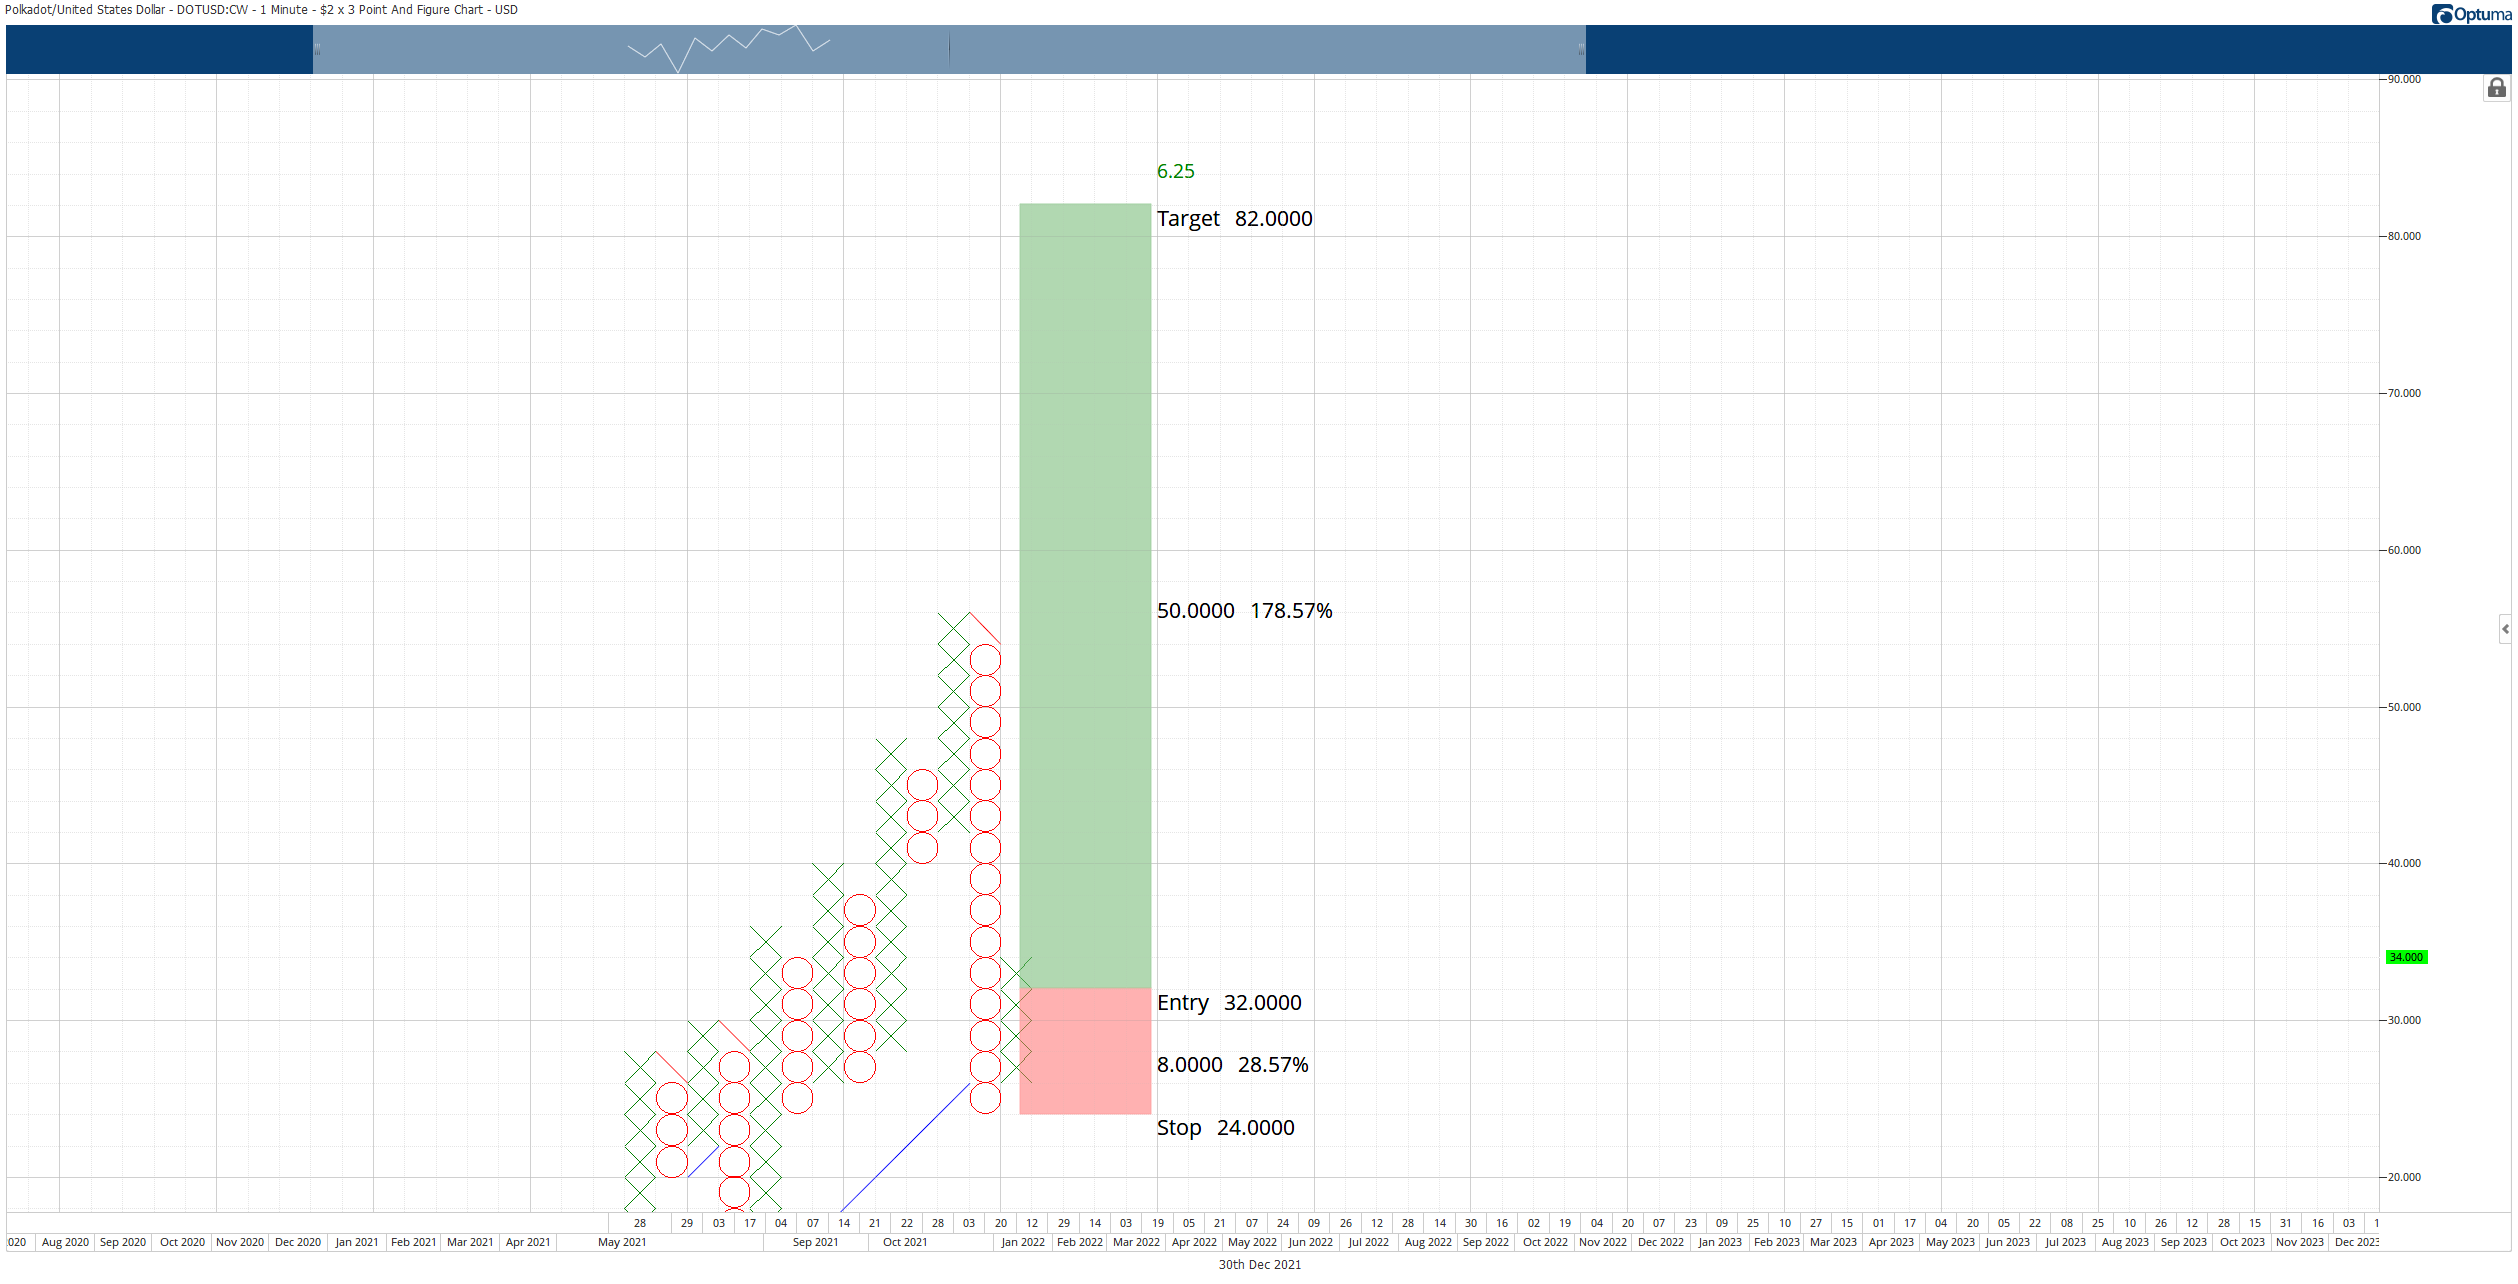
DOT/USDT $2.00/3-box Reversal Point and Figure Chart
Traders should expect some resistance near the $40 value area where the weekly Tenkan-Sen and daily Senkou Span B exist within the Ichimoku Kinko Hyo system.
The hypothetical long setup is invalidated if Polkadot price drops below $20.


