
- Polkadot price formed a double bottom on the daily time frame and rallied 25% so far.
- A continuation of this uptrend is likely to result in a 27% ascent from its current position.
- The MRI also indicates that a buy signal is around the corner, adding a tailwind to the bullish thesis.
Polkadot price crumbled as it tested a crucial resistance level on September 14. This downswing seems to have formed a bottom and rallied exponentially on September 22, indicating that an upswing is on its way.
Polkadot price ready to climb higher
Polkadot price rose 53% between September 8 and September 14 as it encountered the 70.5% Fibonacci retracement level at $38.31. However, a brutal rejection here led to a swift sell-off that crashed DOT by 34% to form a double-bottom at $25.21.
Now, the Polkadot price is hovering above the 50% Fibonacci retracement level at $30.16. Moreover, the Momentum Reversal Indicator (MRI) signal flashed a yellow ‘up’ arrow, indicating that the next red daily candlestick will display a buy signal.
Therefore, a resurgence of buyers is likely to push DOT to slice through the $34.93 resistance barrier and retest $38.31, constituting a 27% advance.
In a bullish case, the Polkadot price could extend the run-up to $41.69.
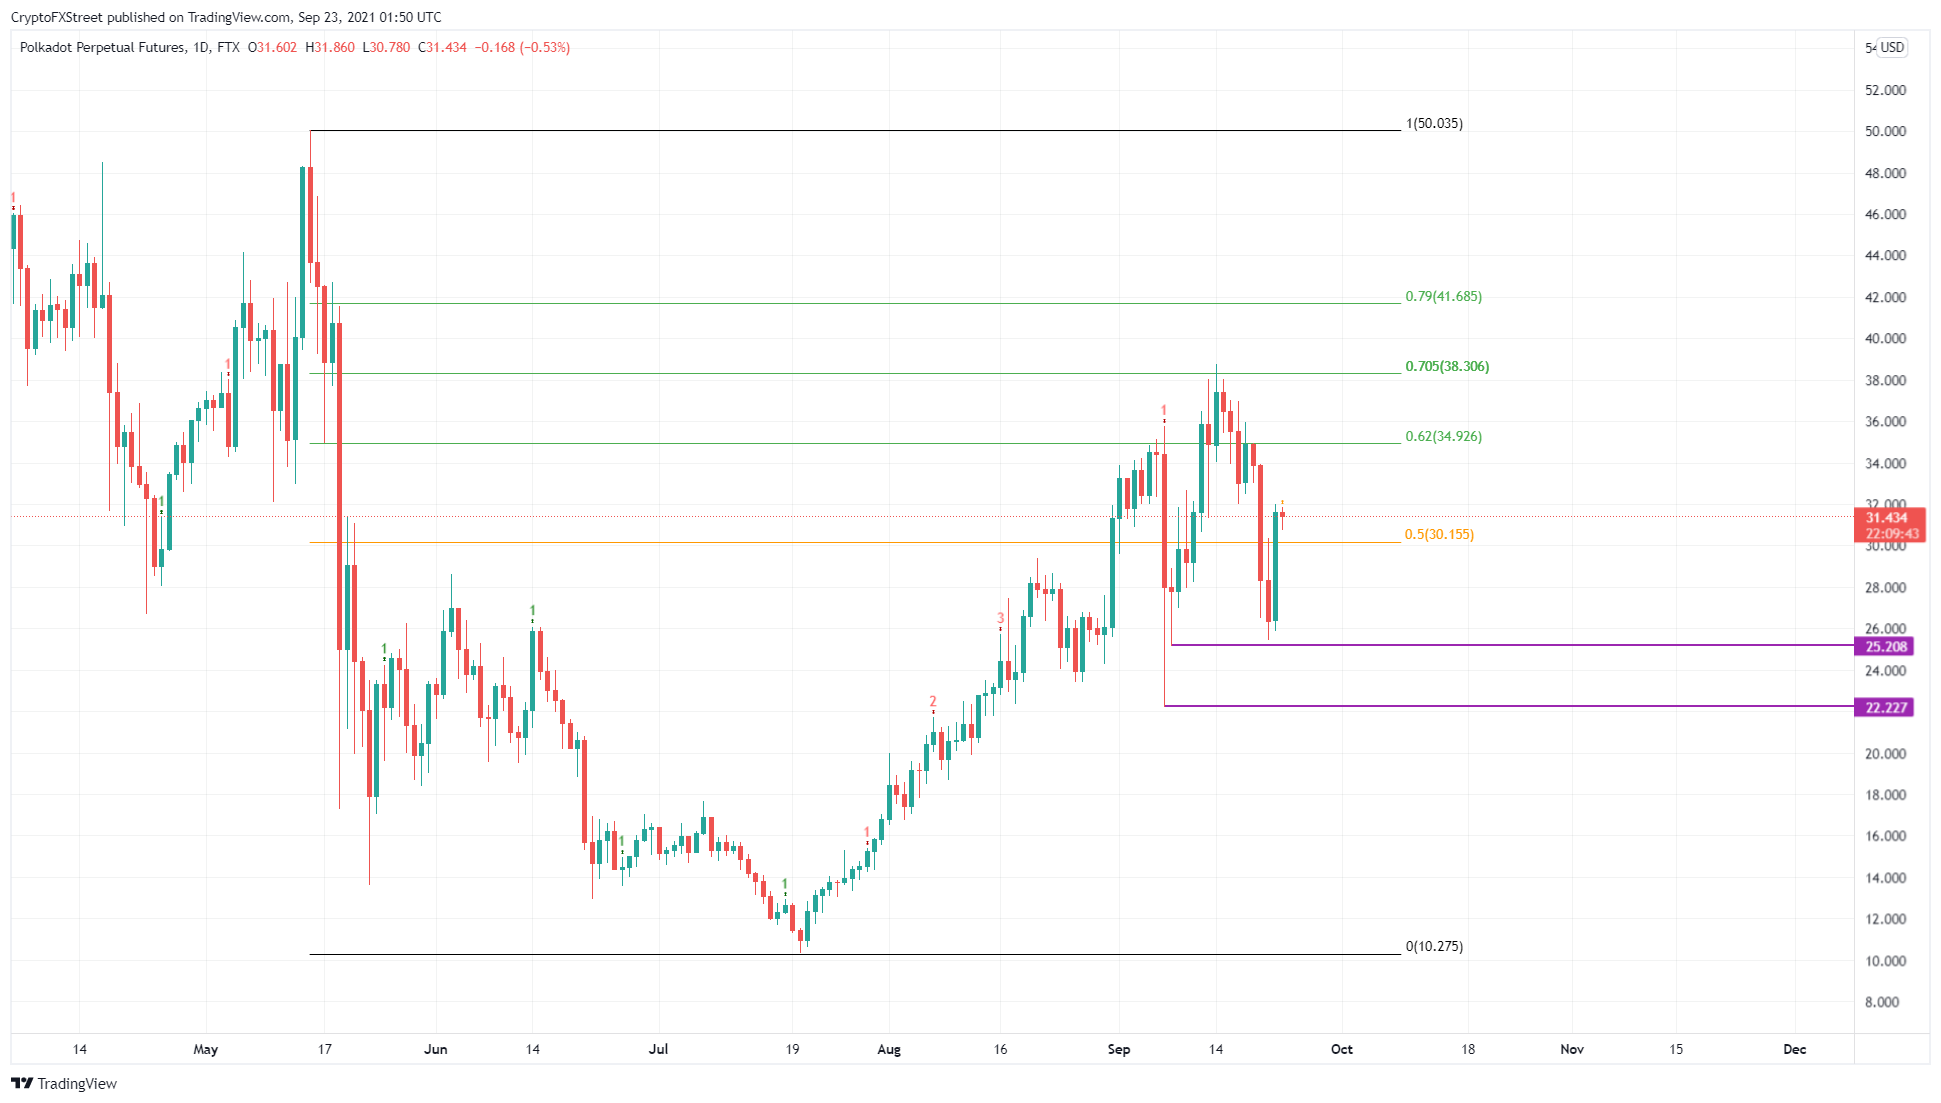
DOT/USDT 1-day chart
While things seem to have improved for Polkadot price, a breakdown of the 50% Fibonacci retracement level at $30.16 will start to sow seeds of doubt into the minds of buyers.
If the investors continue to sell, DOT might revisit the $25.21 support floor.
A decisive daily close below this level will create a lower low, invalidating the bullish thesis and triggering a crash to $22.23.


