
- NZD/USD is poised for a breakout one way or another on the charts.
- The weekly chart is bearish, the daily bullish to a degree while the 4&1-hour charts break down the immediate market structure for the RBNZ event.
It is the Reserve Bank of New Zealand's turn to break to the world its guidance for monetary policy and outlook on the coronavirus risks for which is sure to bring volatility to the Kiwi crosses.
Considering the very solid recovery path in 2021 as it has emerged from a double-dip recession in 2020, the markets are positioned for a 25bp hike and the possibility of more t come before the year is out.
However, the risks are that the RBNZ is unable to fully endorse the market's pricing for an all-out hawkish outcome given the recent announcement of the nation's single covid case, the first in six months, and the entire nation thus thrown into a strict lockdown.
Therefore, the RBNZ might be inclined to leave the OCR unchanged this afternoon.
''Interest rates will head higher in time, but when so little is known about the current outbreak, the best option right now is to wait and see,'' analysts at Westpac argued.
This makes for a highly unpredictable outcome at today's meeting and knowing the market structures with some technical foresight going into the meeting is paramount.
The following illustrates the bias of both the upside and downside in terms of levels, price action and market structure in NZD/USD.
NZD/USD technical analysis
As mentioned in a prior article early in the day, ''the risks are that the Reserve Bank of New Zealand does not hike rates, exposing the currency to the same type of central bank divergence trade-off that the Aussie dollar faced on Tuesday following the dovish RBA minutes.
Considering the positing of where the currency is sat on the daily charts, leaning on the smoothed daily 200 moving average, a break of 0.6880 could lead to a significant move to the downside to test 0.6800/10 and 0.6720 below there for a longer-term target area.
The weekly bearish head and shoulders add additional bearish conviction.''
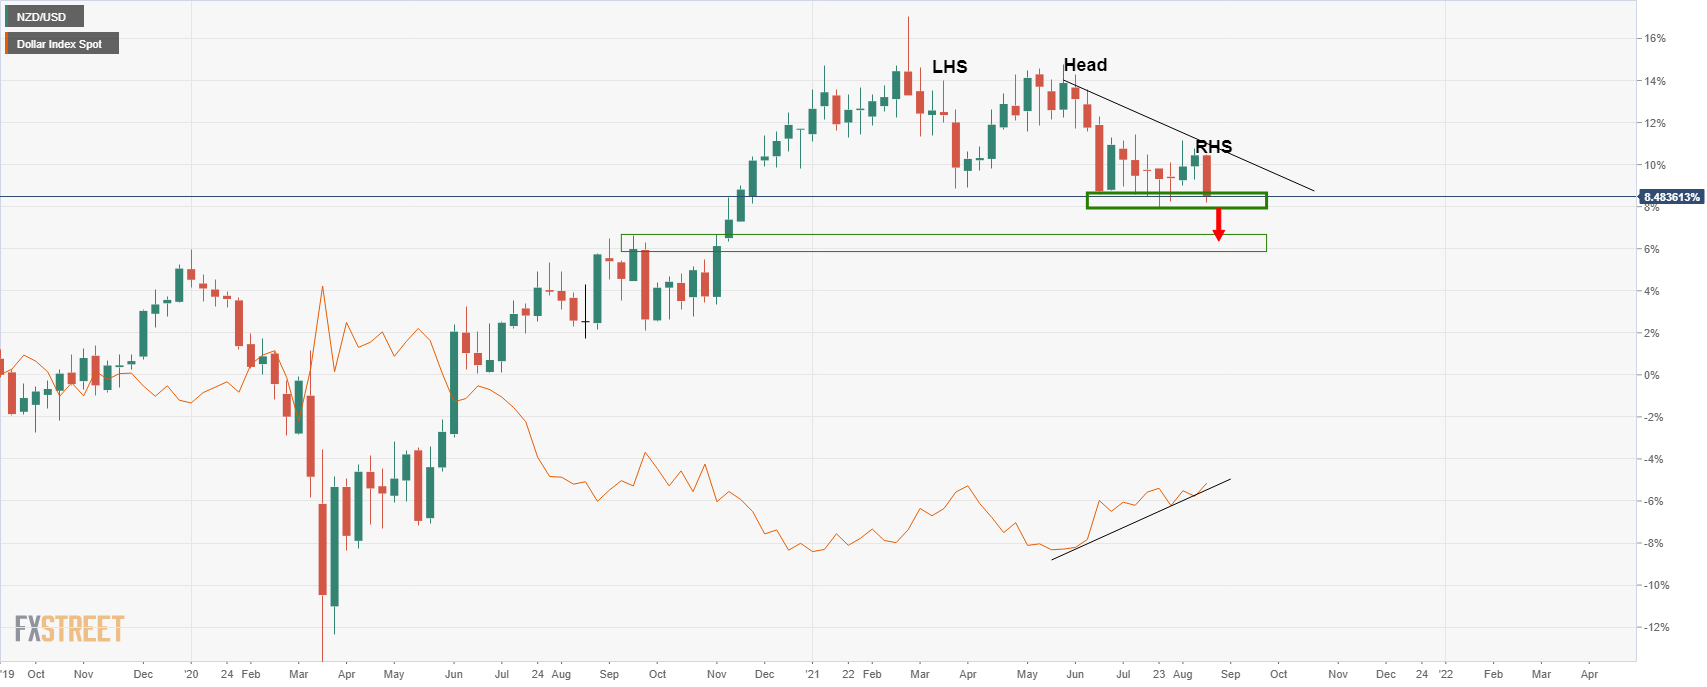
''In the above weekly chart, the head and shoulders are marked and so too are the key support zones.
The US dollar has also been compared and the negative correlation speaks volumes when taking into consideration of the bullish environment the US dollar is embarking on, as highlighted in the following analysis:
-
US dollar bid for its safe-haven status and on central bank divergence
If the kiwi is stripped of a hawkish bias at the RBNZ that it has enjoyed for many weeks, then the path of least resistance is to the downside.
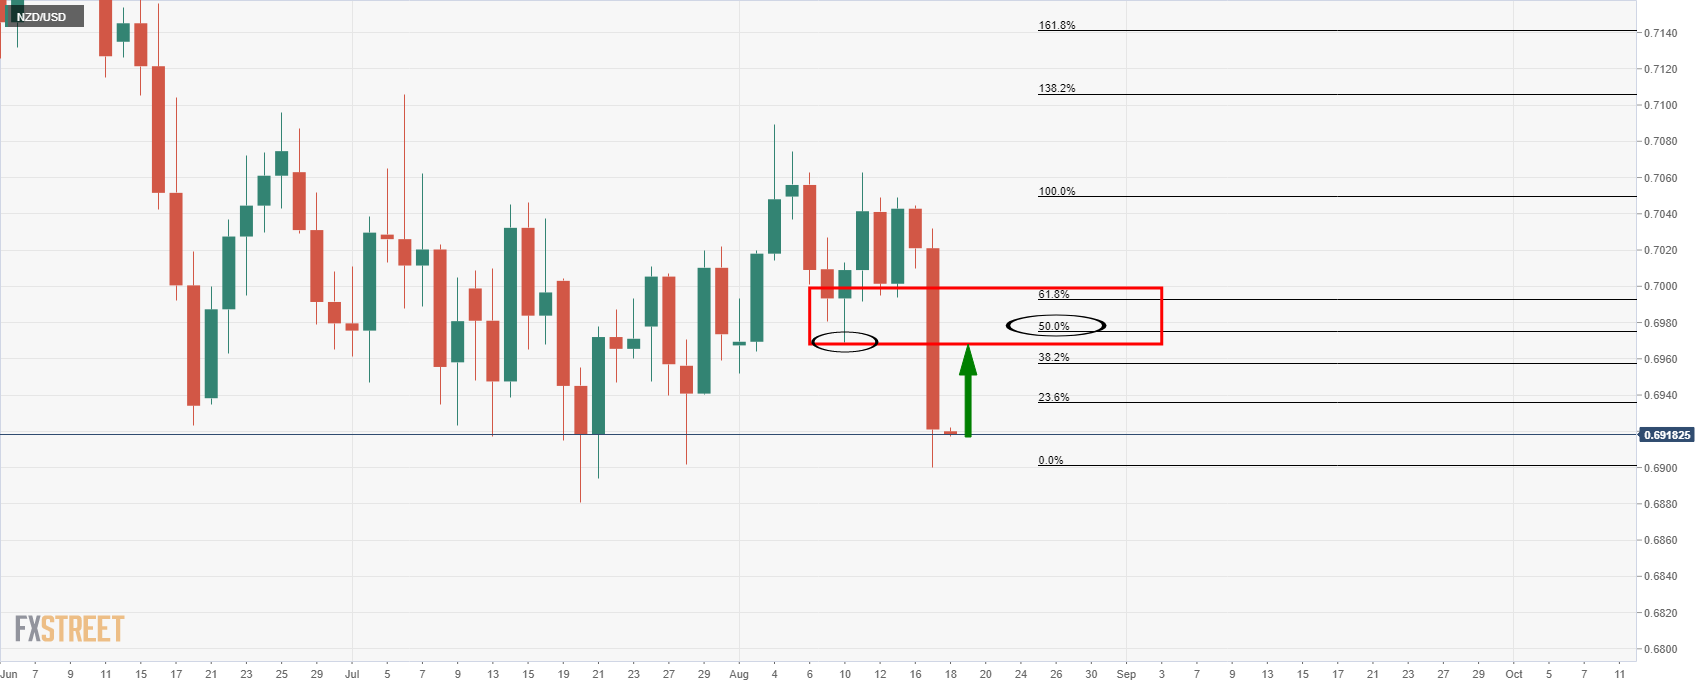
On the upside, the weekly low of 0.6968 will be of interest near a 50% mean reversion of the daily spike to the downside:
Meanwhile, since the above analysis in early Asia, from a lower time frame perspective, the price action has been building up to that meeting which opens some hypothetical scenarios for the outcome of the meeting as follows:
4-hour chart, hawkish outcome
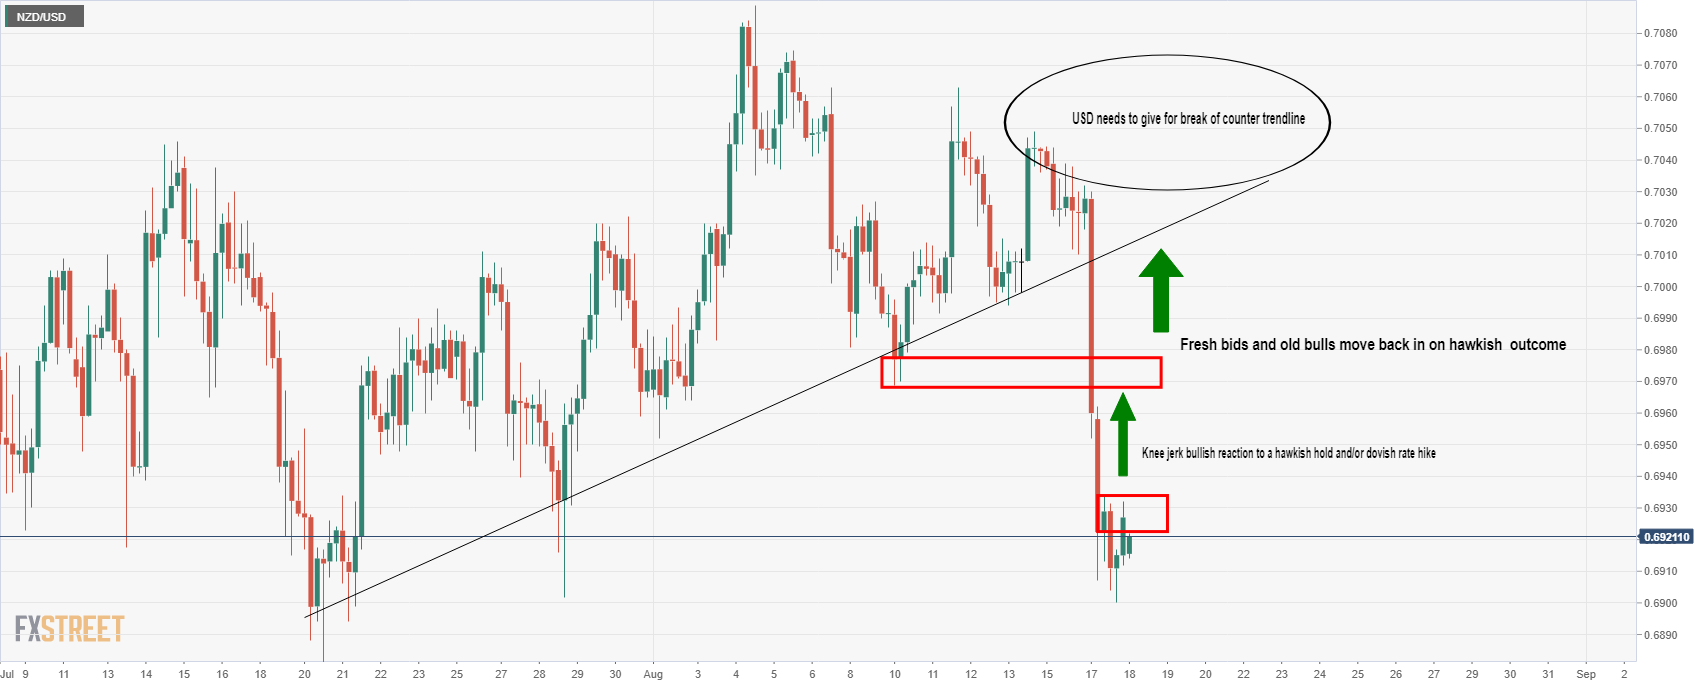
The 4-hour chart is a short-near term view where the price would be expected to rally immediately and in the subsequent days after the event.
The move illustrates a scenario where the bird is picking up some less committed bids that may have bailed ship on the lockdown news and/or fresh bids from those awaiting the outcome who were otherwise sidelined and undecided about the path of the RBNZ.
1-hour chart
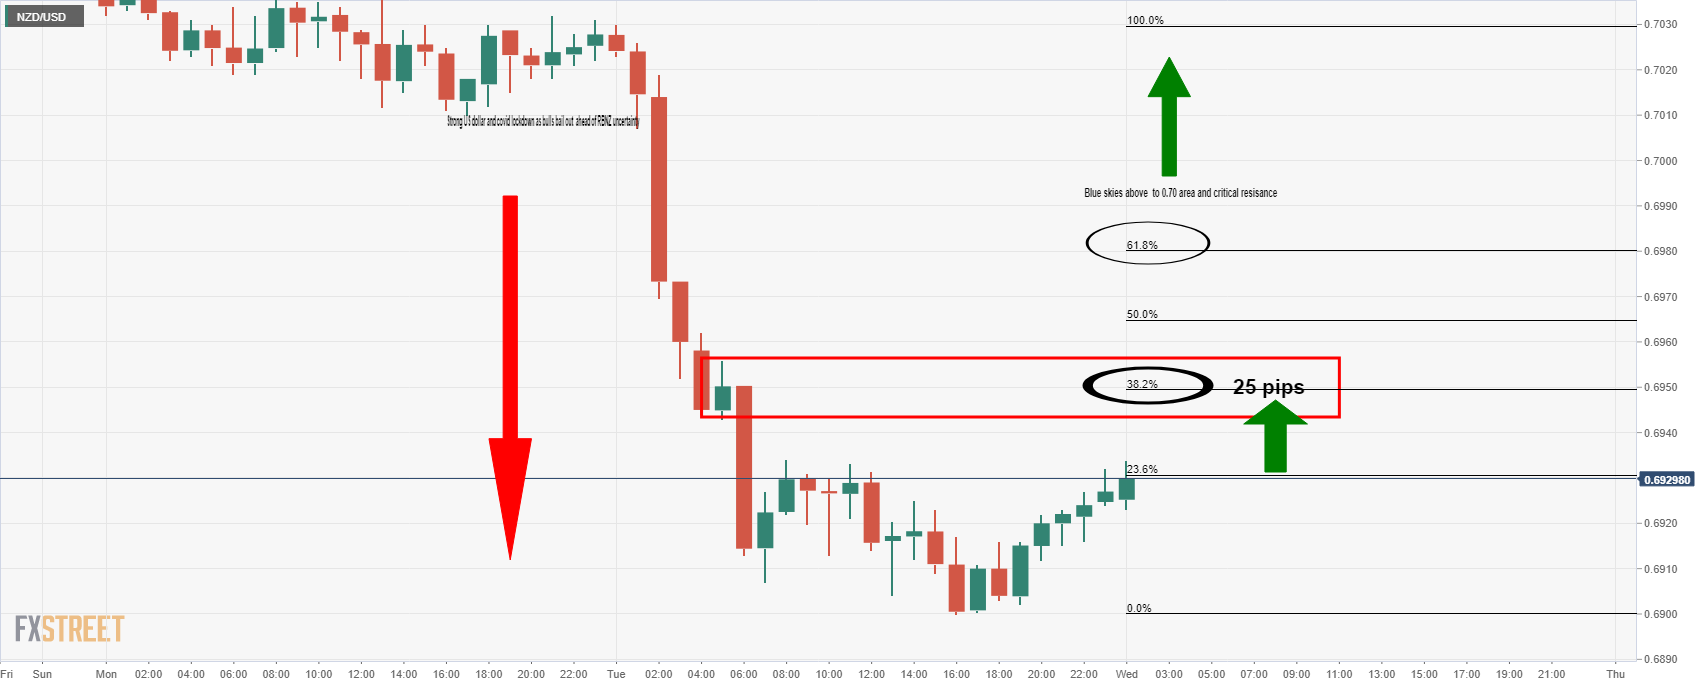
Meanwhile, on the hourly time frame, a quick 25 pips to the 38.2% Fibo could be anticipated on a hawkish hold or from a broadly expected rate hike, even if the RBNZ was dovish on the forward guidance pertaining to the covid uncertainty.
Additional analysis on popular kiwi cross ahead of RBNZ:
-
NZD/JPY Price Analysis: Bulls looking to daily 61.8% Fibo and bears looking to 200 SSMA


