
- Reef Finance price is recovering slowly after its 25% sell-off as it heads toward a resistance level at $0.044.
- A potential fractal from a technical perspective hints at a 15% downswing.
- However, on-chain metrics oppose the pessimistic view and suggest a bullish outlook for REEF.
Reef Finance price followed the entire cryptocurrency market as it tanked. However, REEF seems to have recovered and is eyeing a run-up to the immediate resistance level.
Reef Finance price reveals opposing views
On the 12-hour chart, Reef Finance price shows that most of its moves are within the range that stretches from $0.031 to $0.045. The recent bull run above the containment quickly reverted to the mean, and the sell-off seems to have expedited this downswing.
Between March 11 and March 16, REEF underwent a similar price action as the current one. The reversion to the mean was followed by a swift move to the resistance level at $0.044, where Reef Finance price faced significant selling pressure, leading to a 28% downswing to the lower range.
Therefore, if a similar turn of events were to occur, investors can expect REEF to slide at least 13% to the 50% Fibonacci retracement level at $0.038 after hitting $0.044. However, if the selling pressure continues to build up, Reef Finance price could slide to $0.036.
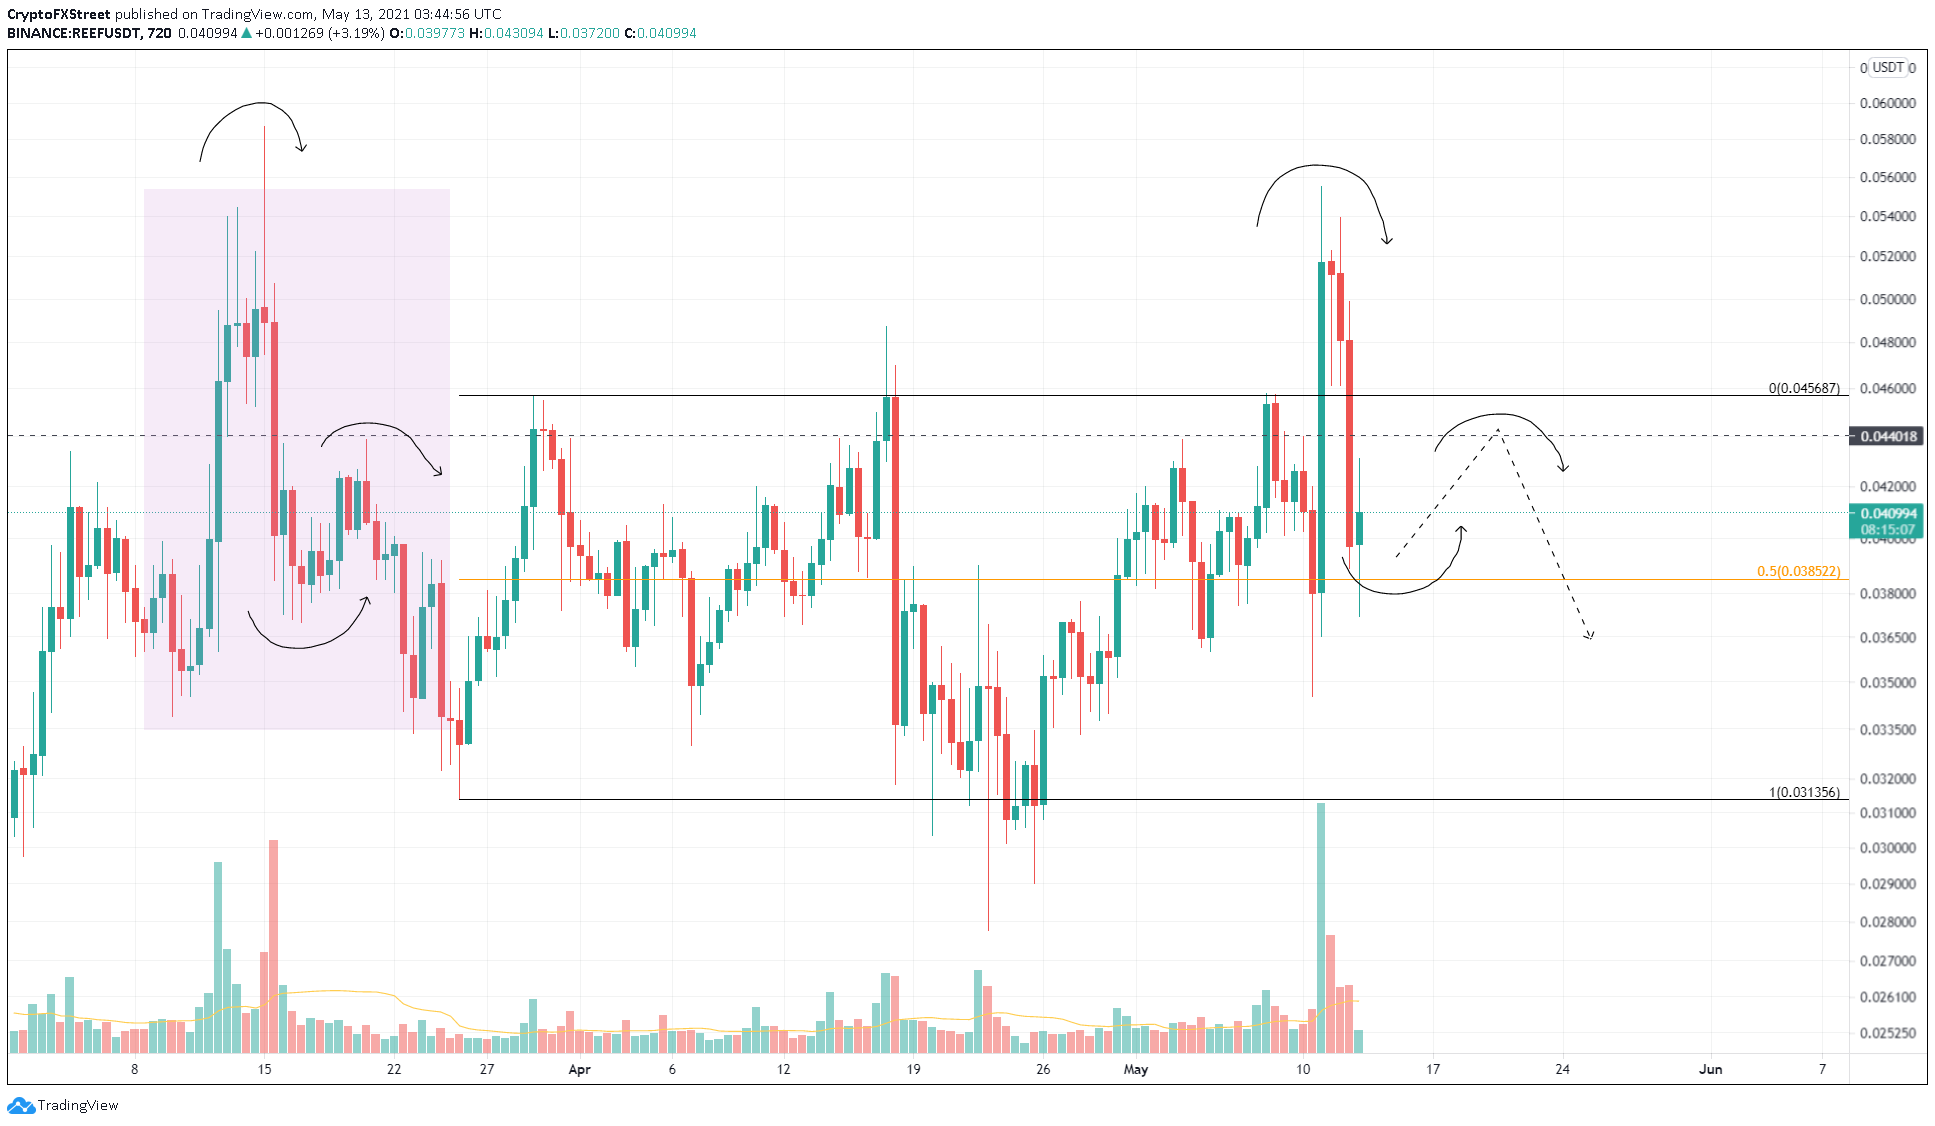
REEF/USDT 12-hour chart
Opposing the bearish view is the 2.75% increase in whales holding more than 1,000,000 REEF. Nine new investors that fall in this category have joined the Reef Finance network since May 12, indicating that they are optimistic about REEF price performance.
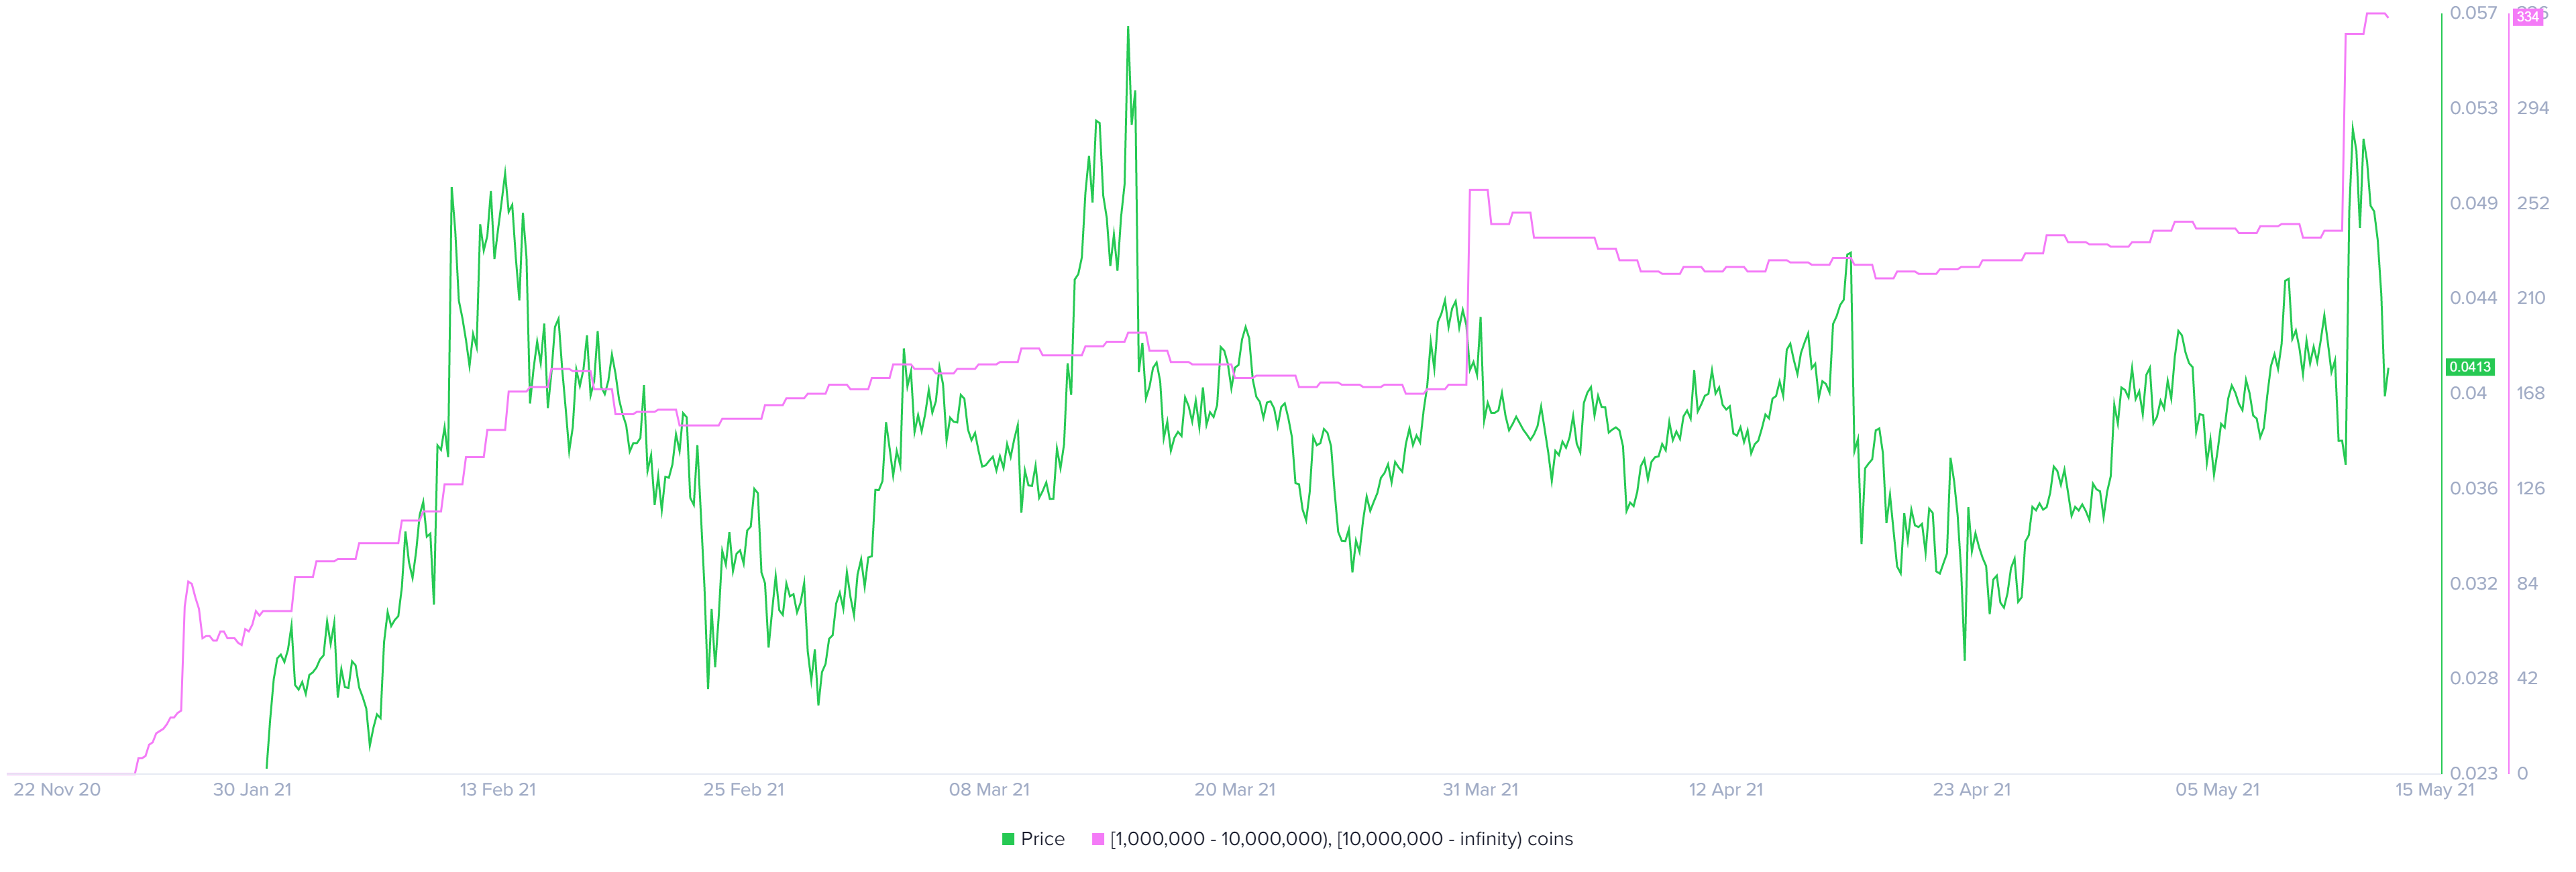
REEF supply distribution chart
On May 11, the number of transactions worth $100,000 or more spiked to 84, the largest spike in its history.
Such a move represents that high net-worth investors are moving their holdings on-chain and are likely to reallocate or sell. Likewise, this uptick resulted in a 33% collapse in REEF price in the following days.
At the time of writing, this metric seems to have waned to near-zero levels, opening up the path for buyers to purchase the token at a discount.
Due to the recent crash, Santiment’s 30-day Market Value to Realized Value (MVRV) model has dropped to -4.74%, known as the opportunity zone. This fundamental index is used to determine the average profit/loss of participants who purchased REEF in the past month.
Its current value indicates that the short-term traders are selling, creating an opportunity for long-term holders to accumulate.
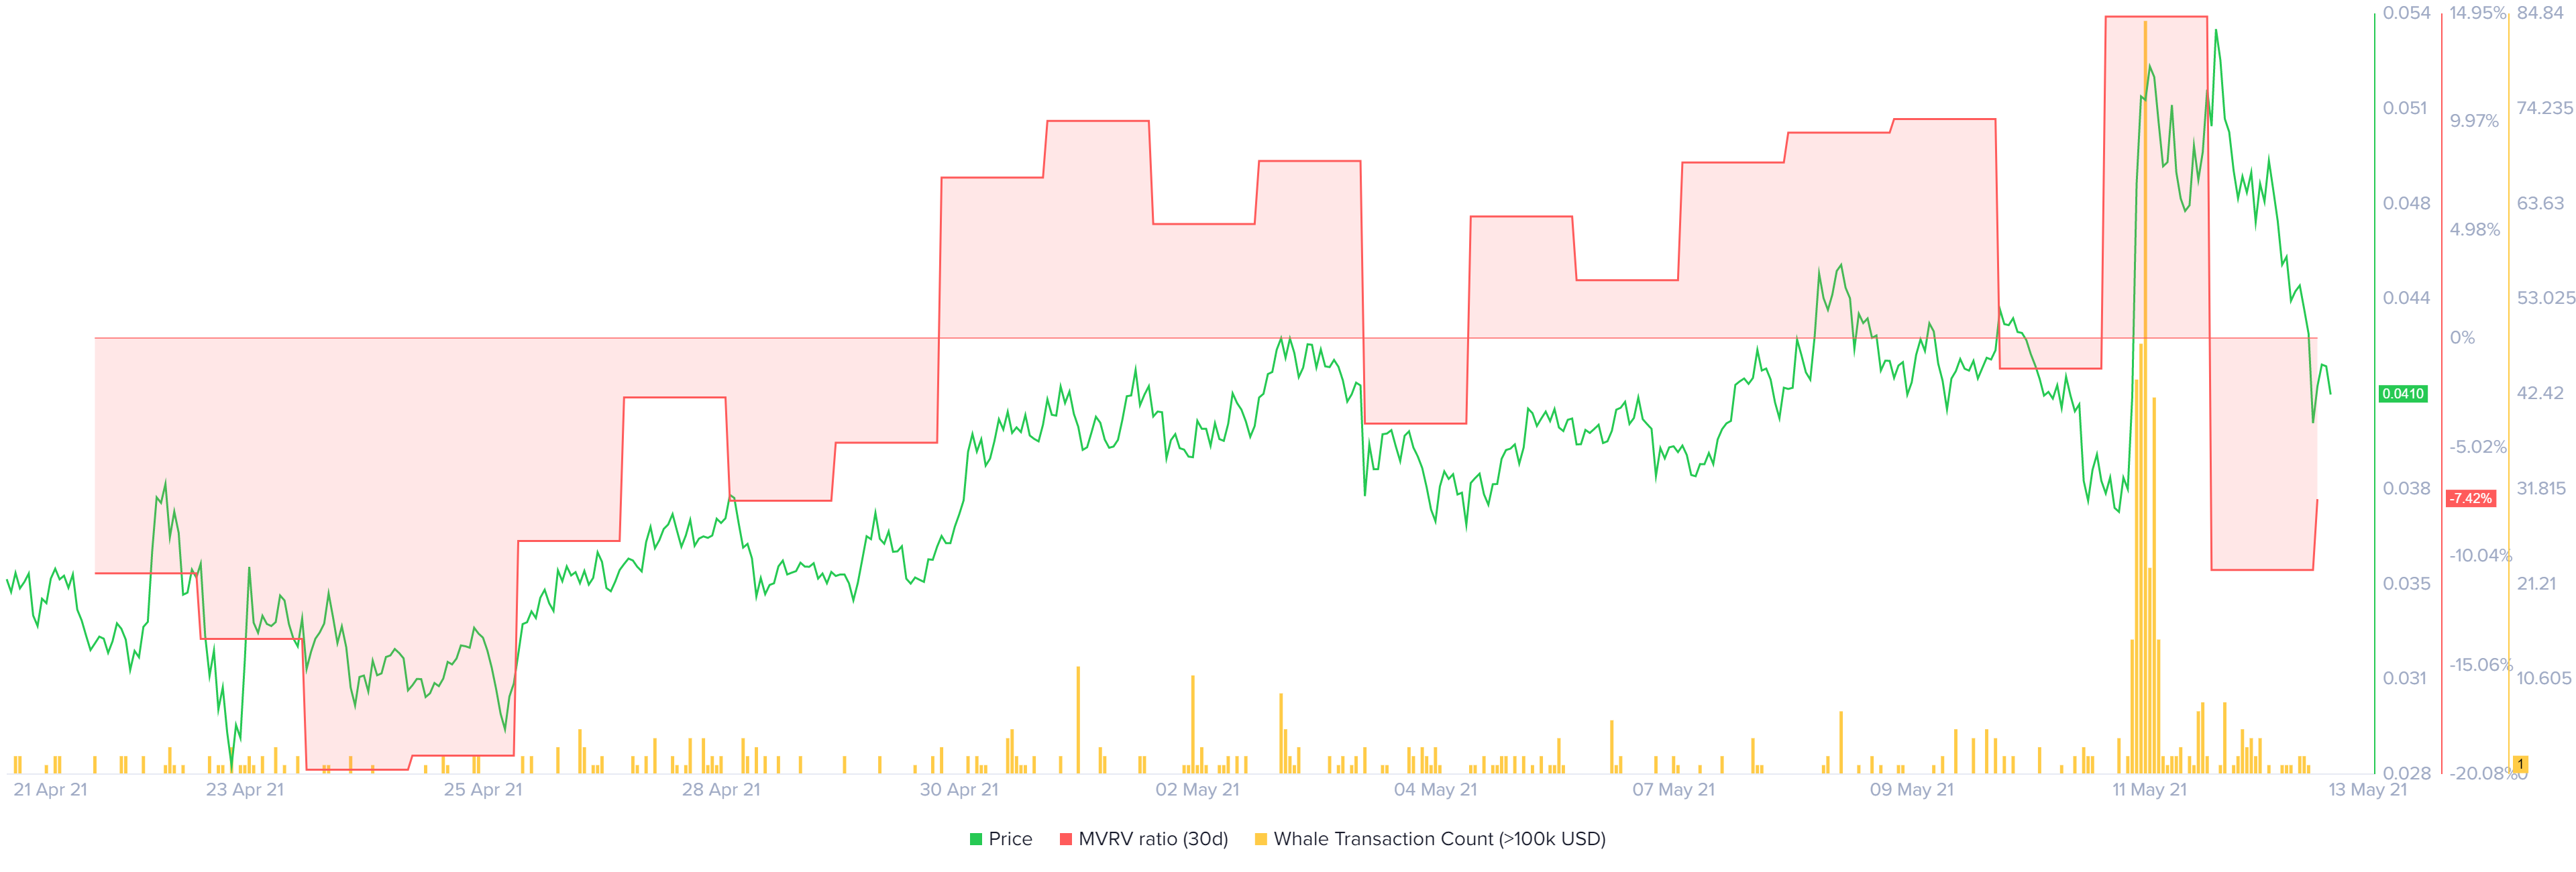
REEF large transaction, 30-day MVRV chart
All in all, the on-chain metrics are displaying a bullish outlook for REEF price. However, the technical indicators present a bearish narrative that projects a drop to $0.038 and $0.0364,
A confirmation for the upswing will arrive after REEF decisively closes above the critical resistance point at $0.044. However, a rejection at this barrier will signal a downtrend’s start.


