
- SafeMoon price has put an 80% crash on the radar as the token is close to recording a lower low.
- SAFEMOON has been trending lower, moving toward the lower boundary of the technical pattern.
- The crypto asset is incentivized to fall further as it has little room to move on the upside.
SafeMoon price could be headed further south as the altcoin continues to trend downwards, opening up the possibility of a big move in favor of the bears. The governing technical pattern has locked SAFEMOON within descending range as the token continues to struggle with any form of recovery.
SafeMoon price offers little hope to escape doom
SafeMoon price is sealed in a descending parallel channel on the daily chart, as investors grow increasingly uninterested in the crypto asset. Trading volume for SAFEMOON has dropped significantly since late May in tandem with its price.
SafeMoon price may face further decline as the token sees little room to move toward the upside. SAFEMOON is close to approaching the swing low recorded on September 10 at $0.00000103. If the token slices below this level, this could open up the possibility of it facing further doom in the long run.
Breaking below the aforementioned swing low could mean that the cryptocurrency may eventually tag the lower boundary of the parallel channel at $0.00000024 with an 80% drop.
Given the substantially low trading volume for SAFEMOON, the bearish target could take some time before materializing.
SafeMoon price may discover immediate support at the August 16 low at $0.00000115, then at $0.00000103. However, falling below this level would mean a new low for SAFEMOON, adding to additional bearish sentiment for the crypto asset.
Additional lines of resistance may emerge at $0.00000067 and $0.00000049, the April 15 low and the April 5 low, respectively.
A spike in sell orders may eventually see SafeMoon price reach the bearish target within the governing chart pattern at $0.00000024, effecting an 80% crash.
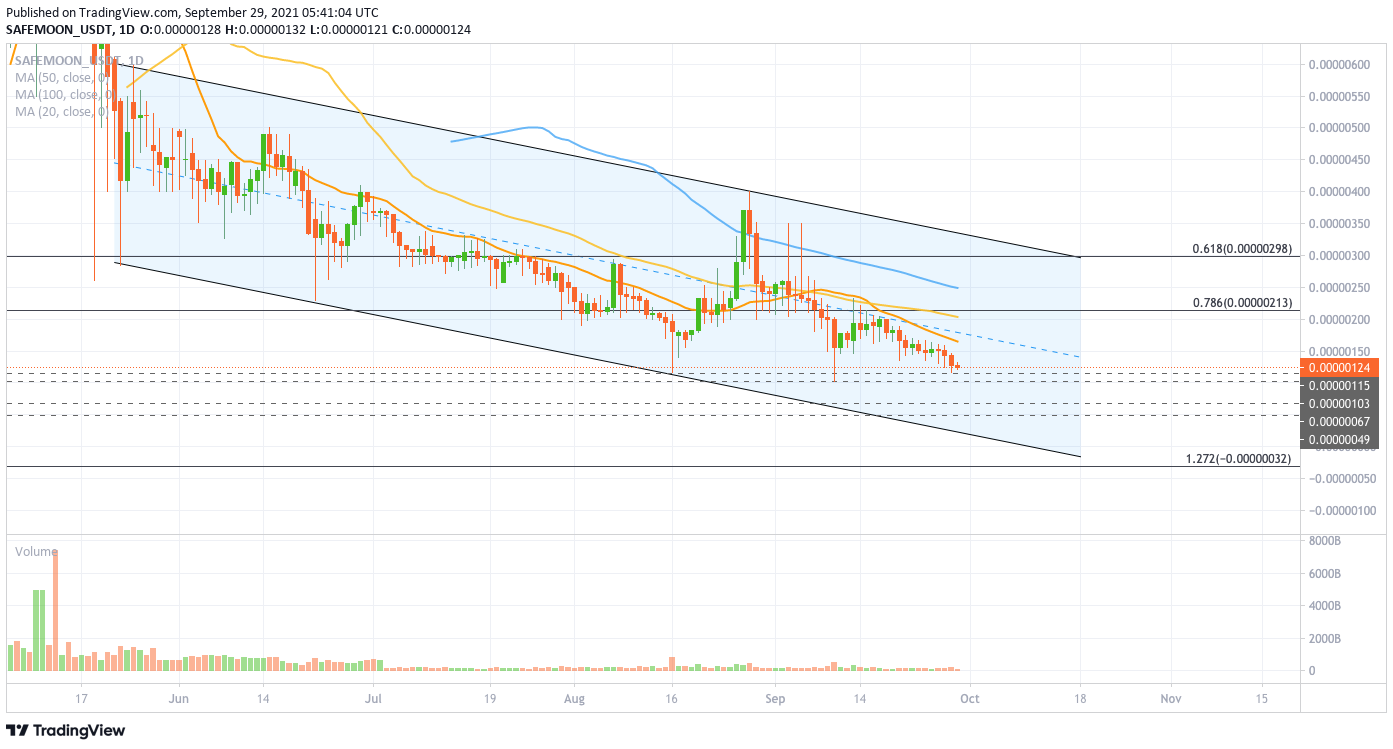
SAFEMOON/USDT daily chart
Should the bulls come to rescue SafeMoon price, the token would be confronted with resistance at the 20-day Simple Moving Average (SMA) at $0.00000165, then at the middle boundary of the chart pattern at $0.00000179.
The following hurdles for SAFEMOON would emerge at the 50-day SMA which sits near the 78.6% Fibonacci retracement level at $0.00000213. Higher levels are not expected at the moment, but should a spike in buying pressure materialize, SafeMoon price could tag the 100-day SMA at $0.00000251 before being confronted with new obstacles.
Like this article? Help us with some feedback by answering this survey:


