
- Shiba Inu is awaiting a 7% drop after losing a quarter of its value from its swing high on August 17.
- The risk is skewed to the downside, as a prevailing chart pattern suggests that SHIB still has room to fall.
- Failure to slice above $0.00000738 could spell more trouble for the bulls.
Shiba Inu has presented a clear downtrend since its local top at $0.00000947 on August 17. SHIB has painted a bearish outlook with a governing technical pattern that suggests the canine-themed cryptocurrency still faces the risks of a 7% drop from the current level.
Shiba Inu bulls dog-tired as SHIB continues to retrace
Shiba Inu is on course for a 19% downswing as a head-and-shoulders pattern has emerged on the 4-hour chart.
The governing chart pattern suggests a pessimistic target toward $0.00000651, coinciding with the 78.5% Fibonacci retracement level, as the bulls hand over control to the bears. The momentum is skewed to the downside, as Shiba Inu has already fallen 12% from the neckline of the technical pattern.
However, Shiba Inu price may discover a foothold at $0.00000686 before plunging toward the aforementioned bearish target. Should SHIB fail to sustain above this level, the dog-themed cryptocurrency may eventually reach $0.00000651.
Further, the breakout line given by the Momentum Reversal Indicator (MRI) suggests that Shiba Inu may see the 7% drop materialize if the bears bust through $0.00000680.
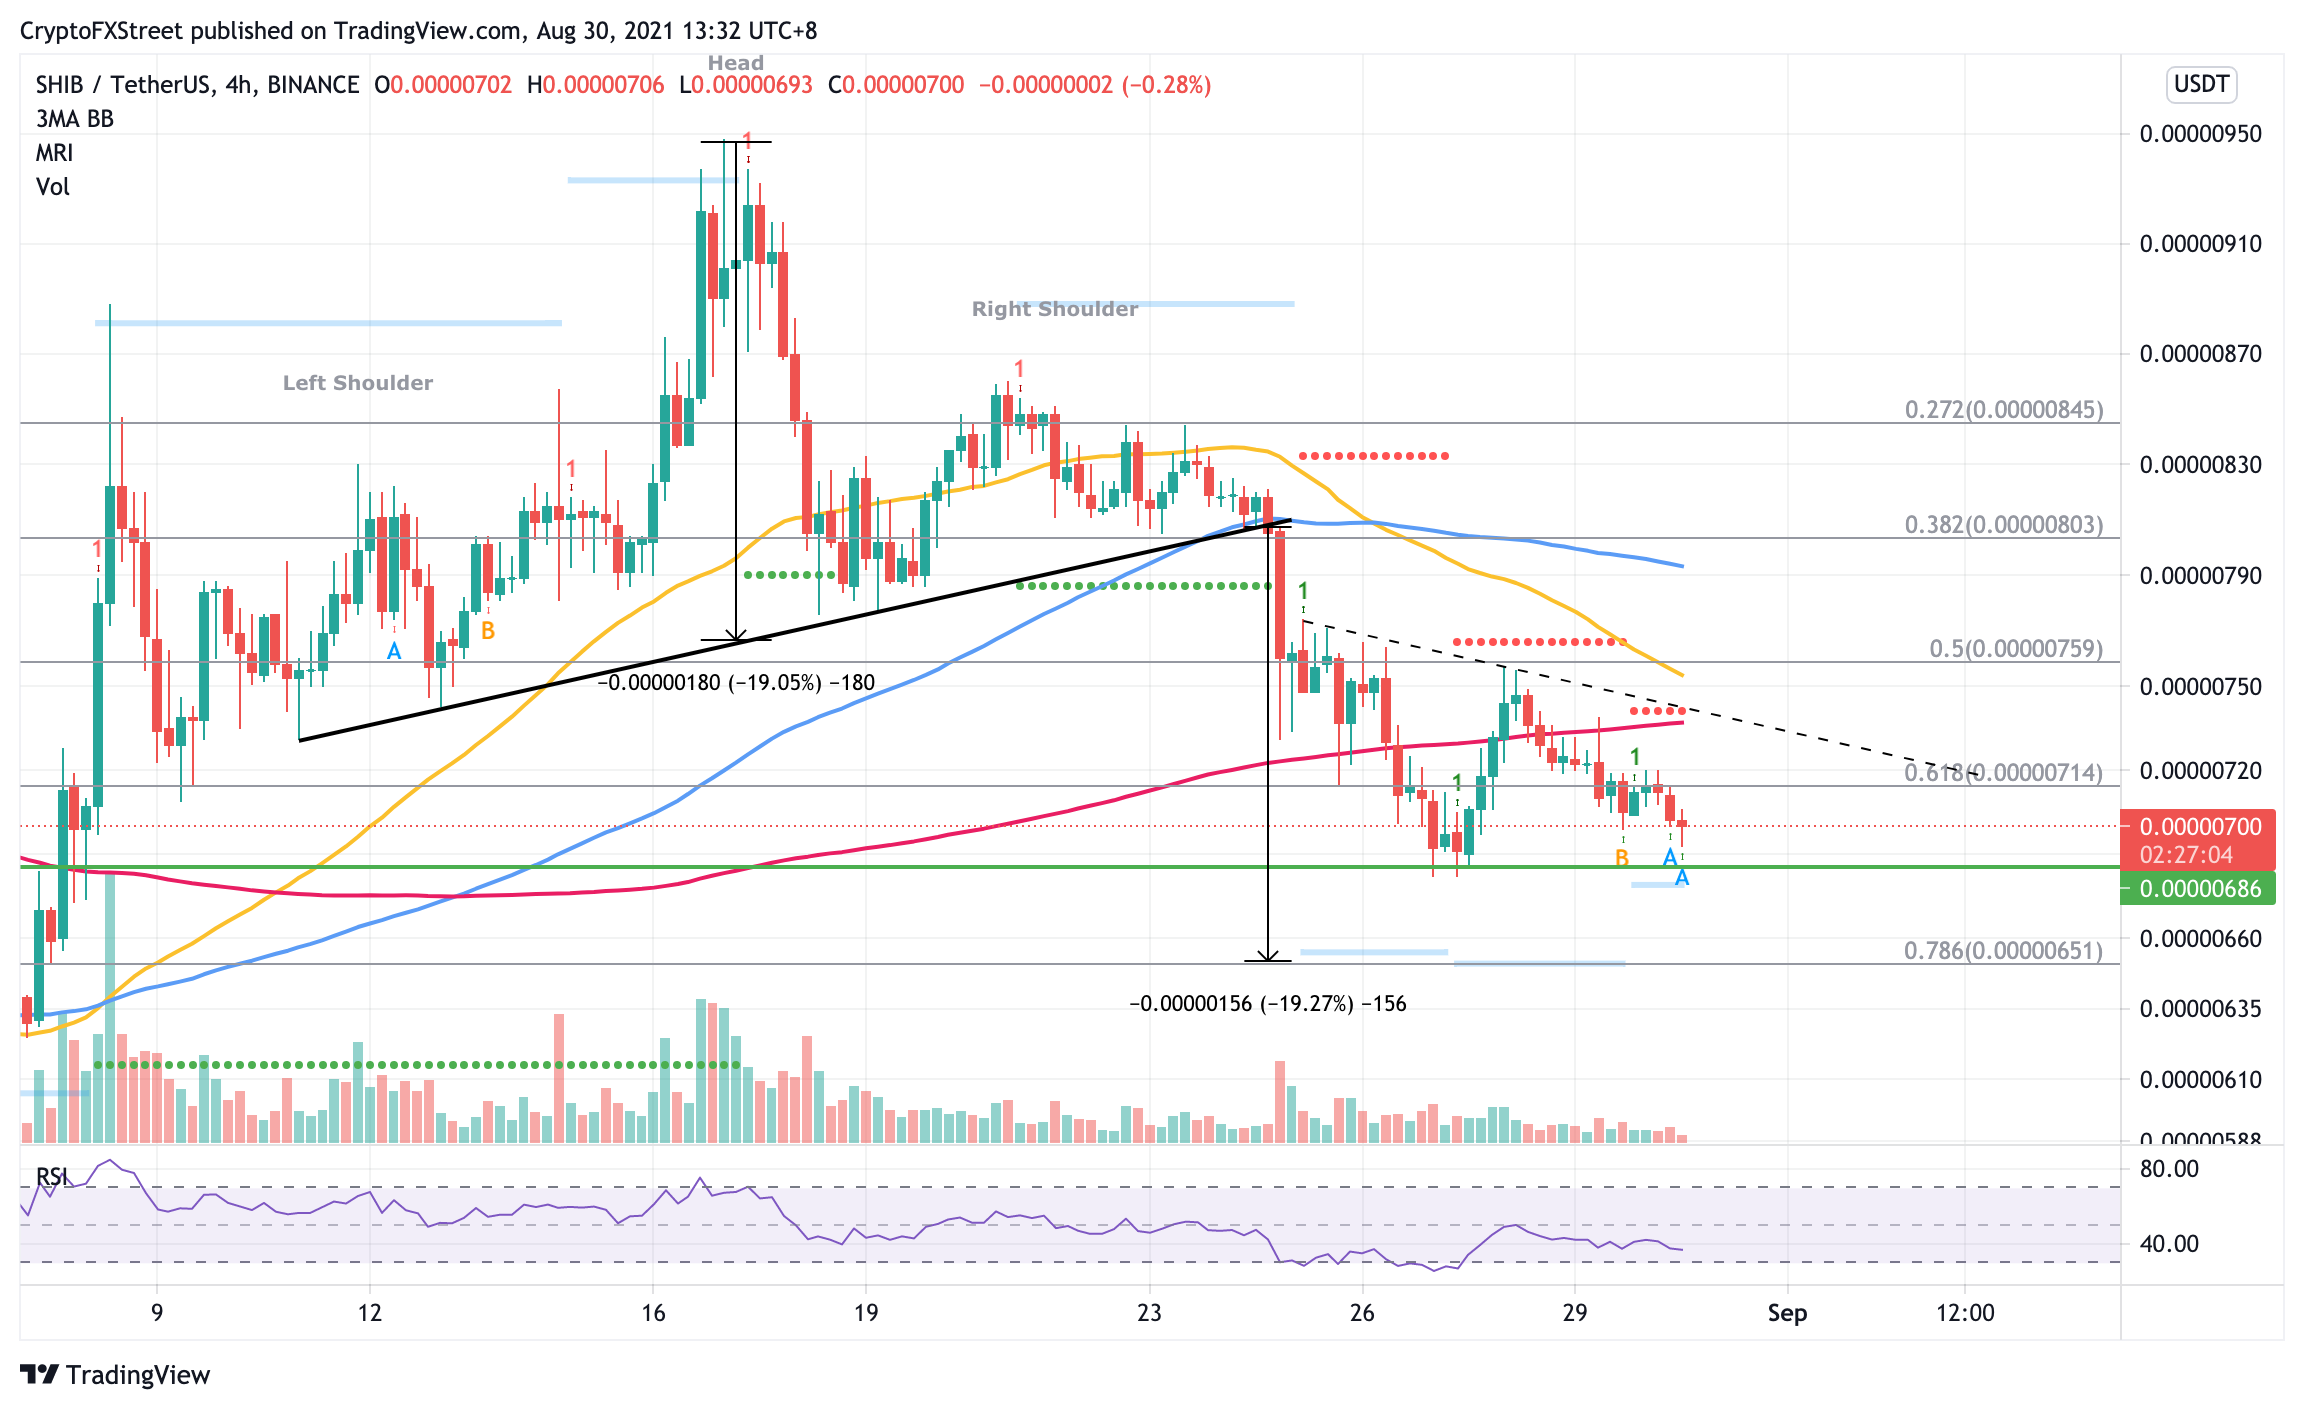
SHIB/USDT 4-hour chart
On the flip side, if the bulls manage to shift price action to the upside, Shiba Inu is most likely to face resistance at the 61.8% Fibonacci retracement level at $0.00000714. The following obstacle may arise at the 200 four-hour Simple Moving Average (SMA) at $0.00000738, coinciding with the resistance line defined by the MRI.
Moving forward, Shiba Inu may continue to print lower highs, as the diagonal resistance trend line that meets the 200 four-hour SMA pressures SHIB in a downward direction. Only a break above $0.00000738 could see the token reverse the period of sluggish performance.
An increase in buying pressure may see SHIB reach the 50 four-hour SMA, near the 50% Fibonacci retracement level at $0.00000759. However, higher levels are not expected of Shiba Inu unless purchasing volume ramps up, shifting the power back to the bulls.


