
- Shiba Inu price faded minutes after the Elon Musk-inspired spike on Friday.
- Corrective bounce could be followed by another pullback before SHIB is ready to begin an impulsive rally.
- 50 twelve-hour simple moving average (SMA) has been instructive for Shiba Inu price since June 16.
Shiba Inu price is formalizing the right shoulder of an inverse head-and-shoulders pattern. Still, the SHIB rally is characterized as corrective, and the 50 twelve-hour SMA impedes the pattern’s completion. A short pullback would best serve the price structure, creating a higher low and the space to engineer an impulsive rally through the moving average and the pattern neckline.
Shiba Inu price action rebound still looks a little suspicious
Shiba Inu price collapsed over 40% from the June 15 high of $0.00000986 to the June 22 low of $0.00000560 after being overwhelmed by the selling that gripped the cryptocurrency complex. SHIB did manage to hold the June 11 low, establishing a point to build the right shoulder of the visible inverse head-and-shoulders pattern.
Shiba Inu price responded to the swift decline with a 50% rebound from the June 22 low to the June 25 high. Still, despite the impressive rebound, the price structure has wedged higher, rather than impulsively and supported by bursts of above-average volume. Thus, there is a high probability that SHIB will pull back and form a higher low before resuming higher and underpinned by a robust volume profile.
The measured move target of the inverse head-and-shoulders pattern is $0.00001712, equating to an 82% gain from the current position of the neckline. The rally target of $0.00001754 is slightly below the May crash’s 38.2% Fibonacci retracement level.
To reach the neckline at $0.00000936, Shiba Inu price will need to rally approximately 25%, overcoming the combative resistance established by the declining 50 twelve-hour SMA at $0.00000748.
A Shiba Inu price breakout above the neckline would meet resistance at $0.00001048 and then the merger of the May 24 high at $0.00001201 with the May 20 high at $0.00001214. After those levels, there is no meaningful resistance for SHIB until the measured move target of $0.00001730.
Interestingly, other cryptocurrencies like XRP and ZIL formed inverse head-and-shoulder patterns before delivering significant investment returns, albeit with a larger footprint.
However, if SHIB speculators seek an earlier entry into the trade, a close above the 50 twelve-hour SMA could be a pilot buy trigger. Or, if Shiba Inu price does pull back as anticipated, investors could buy into the weakness near solid support such as the May 19 low.
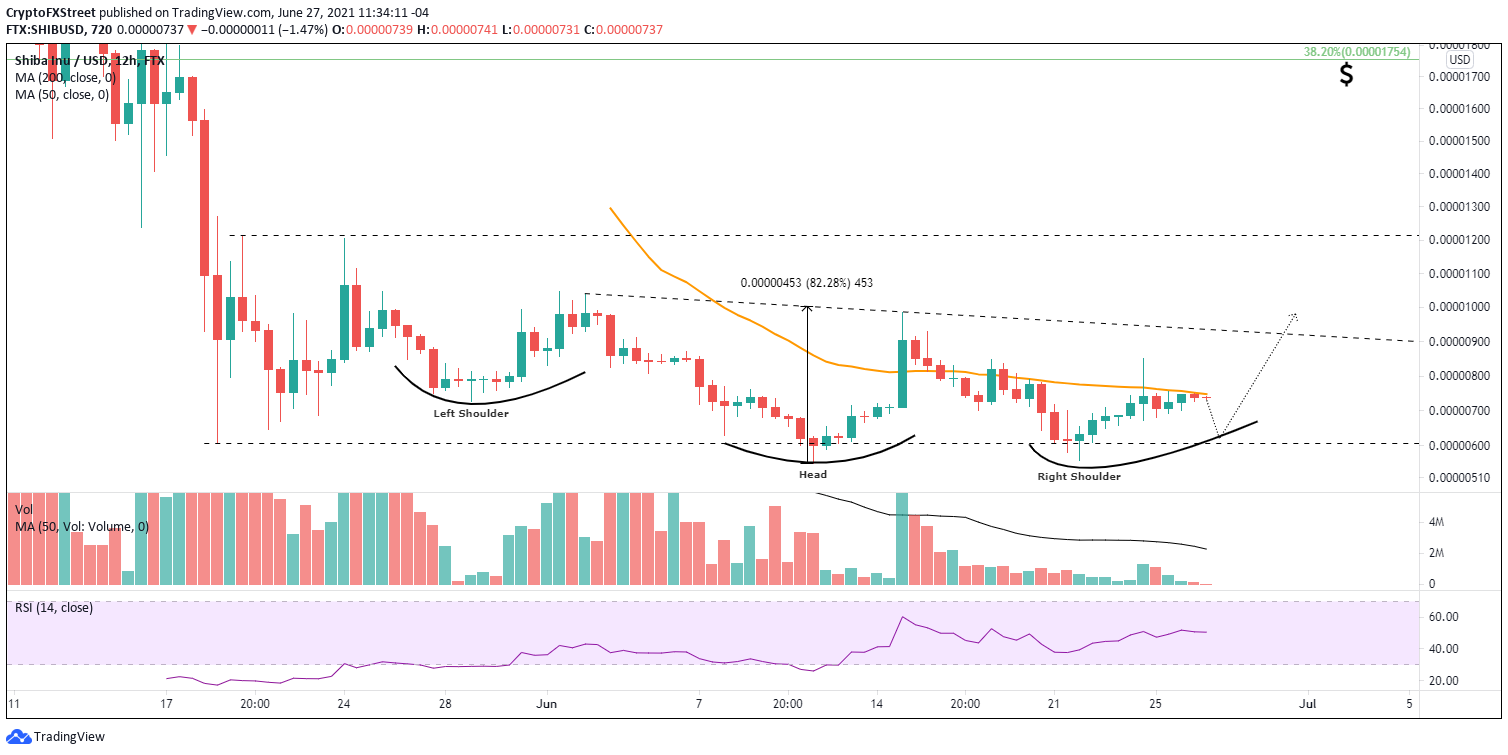
SHIB/USD 12-hour chart
For now, the right shoulder price action can be defined as reluctant, but that could change. Nevertheless, a pullback in SHIB needs to hold the May 19 low to maintain the current price structure. A decline below the head’s low at $0.00000550 would void the pattern, exposing Shiba Inu price to sizeable losses. It is a possible outcome for the dog-themed cryptocurrency should the cryptocurrency complex suffer a new wave of selling.
The quick fade of Musk’s tweet hints that FOMO still is hibernating, and SHIB projections are best framed by pattern recognition and level confirmation. Thus, Shiba Inu price appears more attuned to the oscillations of the cryptocurrency market and may be waiting for a collective, impulsive rally among altcoins to guide the new trend.


