
- Shiba Inu price continues the formation of the right shoulder of an inverse head-and-shoulders pattern.
- 50 six-hour simple moving average (SMA) now trending higher, dedicating support to the right shoulder consolidation.
- A decisive close below $0.00000801 would void the bullish SHIB thesis, elevating the odds for a more complex bottom.
Shiba Inu price has been engaged in a multi-week bottoming process that illustrates an inverse head-and-shoulders pattern and a precise trigger. The completion of the right shoulder should be near as SHIB seeks a rally of 80% based on the measured move of the pattern.
Shiba Inu price shows confidence, and volume delivers on conviction
Since the May 19 crash, Shiba Inu price has struggled to plot a constructive bottoming pattern with a timely entry point. Nonetheless, since June 29, SHIB has consolidated confidence in the potential inverse head-and-shoulders pattern with a symmetrical right shoulder inspired by a textbook volume profile.
As Shiba Inu price releases the oversold condition on the intra-day Relative Strength Indexes (RSI) following the 70% spike from the June 22 low to the June 29 high, investors need to monitor the 200 six-hour SMA as it slips through the right shoulder of the formation. Without the support of the strategically important moving average, the challenge increases for a successful resolution of the SHIB pattern.
Of course, it should be mentioned that the 50 six-hour SMA is crossing above the 200 six-hour SMA, triggering a bullish Golden Cross pattern on the six-hour SHIB chart, thereby adding some positivity.
The measured move target of the inverse head-and-shoulders pattern is approximately 80%, projecting a Shiba Inu price of $0.00001720 from the neckline at $0.00000936. The rally would leave SHIB just below the 38.2% Fibonacci retracement level of May’s correction at $0.00001754.
An 80% gain in a perplexing cryptocurrency complex would be a notable achievement for SHIB. However, a more realistic Shiba Inu price target is the resistance between $0.00001204 and $0.00001214, marking the fusion of the May 20 and 24 highs. A rally to $0.00001214 would conclude with a 30% gain from the current position of the neckline at $0.00000936.
Critical to the full realization of the 30% gain is overcoming the minor resistance established by the June 2 high at $0.00001048.
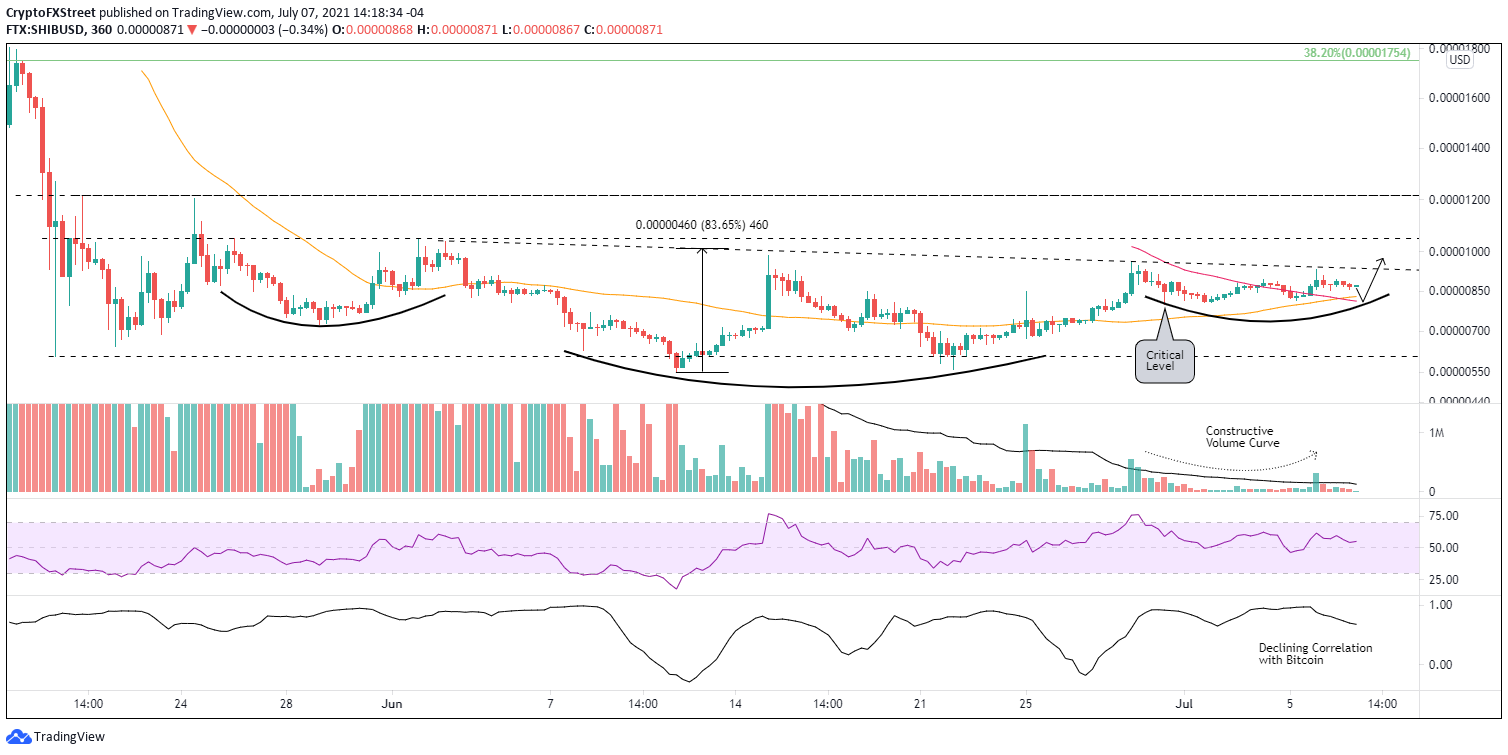
SHIB/USD 6-hour chart
If Shiba Inu price closes below $0.00000801, the bottoming process and the resulting inverse head-and-shoulders pattern will be questioned. A close below that level would eliminate the support provided by the 50 six-hour SMA and, at a minimum, project a more complex right shoulder and, at worst, a reversion to the lows of the head around $0.00000550.
For now, the working thesis is for a bullish resolution of the inverse head-and-shoulders pattern and a rally of at least 30%. The narrative is based on the superior volume profile underlying the head and right shoulder formation, the building of relative strength versus the cryptocurrency market and the growing dominance of altcoins versus Bitcoin over the last two weeks. Combined, they emulate a digital asset trading with conviction and confidence.
Here, FXStreet's analysts evaluate where SHIB could be heading next as it seems bound for higher highs.


