
Solana did very little on Friday as we continue to see the $101 level as an area that continues to offer support. The $100 level just below there also offers a significant amount of support, so I think this is more or less going to be a “support zone.” If you look at this chart, you can see that the market has gone sideways for a little over a week, and now it looks as if we are going to continue to see this market try to figure out what is going to happen next.
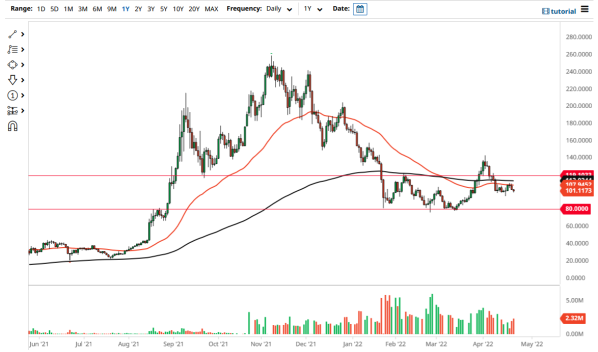
Just above, we have the 50-day EMA near the $108 level and going sideways. At this point, the market looks as if it is simply trying to figure out what to do next, as it has been sideways for a while. If we break down below the $100 level, that would be a negative turn of events, and more likely than not would send the Solana market down to the $80 level. The $80 level has been important multiple times in the past, so I think it would make a nice target, as well as a major support level. If we break that level to the downside, that would be the worst-case scenario for Solana, and would almost certainly send this market to reach the $50 level.
On the upside, if we were to break above the $120 level, then it opens up the possibility that the market could recover. If we can break above the $120 level, then Solana could go looking to the $140 level as a target. Breaking above that market could then send the Solana market to the $160 level.
In general, I think the one thing that you are probably going to see is a lot of volatility and a way of mimicking Bitcoin and Ethereum more than anything else. It is worth noting that we are going to continue to see a lot of chop here, just as we have seen in various crypto markets. Until Bitcoin does something, Solana is probably going to sit still. Even more of a correlation would be Ethereum to this market.


