
- Solana price falls just short of the 141.4% Fibonacci extension of the May collapse during the intra-day scramble higher.
- SOL has climbed 47.04% over the last three days based on closing prices, marking the best three-day gain since the end of February.
- SOL mentions on social media channels reached over 20% of the total cryptocurrency traffic on August 16.
Solana price has climbed 170% since July 21, breaking through the symmetrical triangle’s measured move of 69% and the previous all-time high of $61.44 before coming within two points of the 141.4% extension at $79.00 today. However, SOL is set to consolidate based on the extreme readings on several indicators and today’s rapid retracement. The May 18 high of $61.44 should offer some support during the corrective process.
Solana price strikes a buying frenzy
The market-leading performance for Solana price has its origins in a symmetrical triangle that developed from the May crash and triggered on July 30 with a daily close above the triangle’s descending trend line. The velocity and magnitude of the resulting advance carried the daily Relative Strength Index to the highest reading since April 2020 and SOL's deviation from the 20-day simple moving average (SMA) to 61.25%, based on the Percentage Price Oscillator (PPO).
The notable readings on a series of indicators indicate that Solana price will now pursue a correction or consolidation. For example, similar RSI readings in the past, including February 24, February 12 and August 12, 2020, coincided with short-term peaks for SOL, with the three consolidations averaging 34.93% and six days. Moreover, the last time the deviation from the 20-day SMA reached at least 50%, Solana price trended sideways for several weeks.
If Solana price topped today at $77.26, a 34.93% pullback would take the altcoin down to $50.22, slightly above the 50% retracement of the advance from the July 20 low at $49.61, and the SOL low should be printed around Monday.
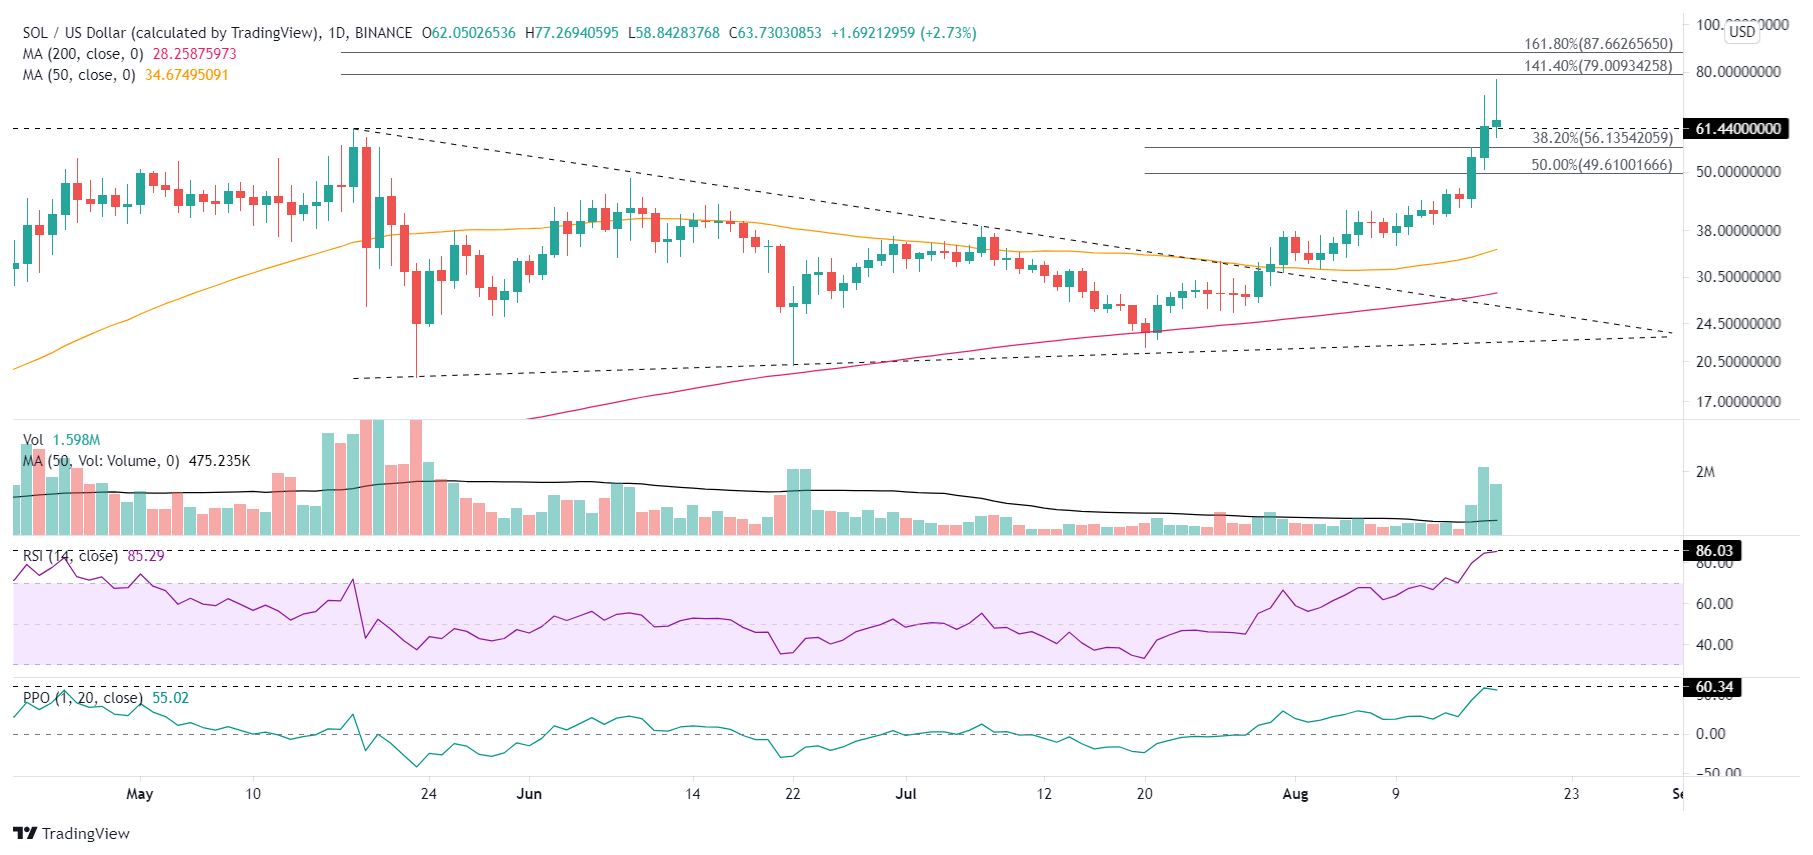
SOL/USD daily chart
Solana price could ignore the stretched indicators and the bearish momentum divergence on the intra-day charts and continue the SOL surge. Points of reference are the 141.4% extension at $79.00, the 161.8% extension at $87.66 and the psychologically important $100.00.
A reflection of Solana price momentum is the dominance of SOL in cryptocurrency social media over the last couple of days. At one point yesterday, SOL accounted for over 20% of the total cryptocurrency traffic. A rare reading for any digital token, but not the highest percentage of SOL mentions in 2021. Nevertheless, it shows that the advance in Solana price had gone viral, FOMO had arrived, and a temporary high was in sight.
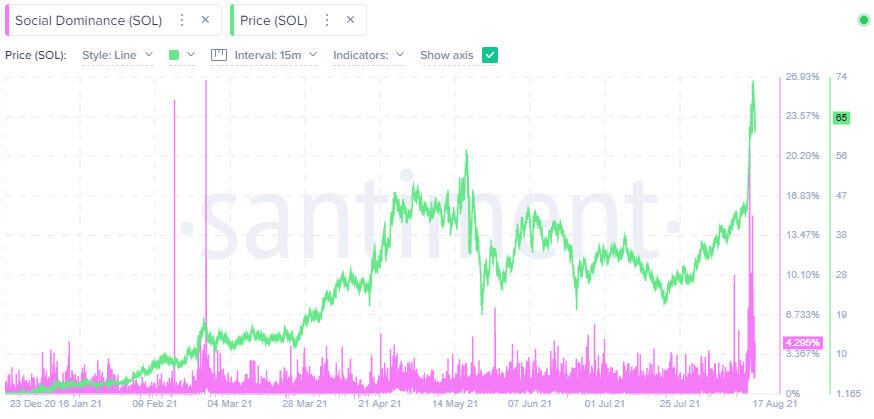
SOL social dominance – Santiment
The conditions for Solana price are highly fluid at the moment, with the potential for a sharp move in either direction being a strong possibility. However, the stretched indicators and the heavy social media traffic suggest that the audacious advance has ended, at least temporarily. Furthermore, historical precedent instructs SOL speculators to be aware of the potential for a 40% decline from the intra-day high.


