
- Solana price flashes potential bear trap after breaking down from a multi-week rising wedge pattern.
- SOL may close today with a bullish engulfing 12-hour bar.
- 61.8% Fibonacci retracement level of the May correction offering active resistance since June 4.
Solana price has been climbing higher, illustrating a rising wedge pattern that broke to the downside today as the cryptocurrency complex turned red. SOL has quickly recovered and is at the top of the leader board with a 9% gain, suggesting it is readying to continue the quest to the all-time high.
Solana price cheats bearish market dynamics
Over five days, Solana price collapsed over 67%, locating a firm low on May 23. It recorded the largest weekly decline at almost 48% and the largest correction for the tremendous rally since December 2020. By yesterday’s high, SOL had rebounded by 130% and was placed around the tactically important 50-day simple moving average (SMA) at $39.54.
The persistent SOL rebound broke with the pattern displayed by other cryptocurrencies, most often highlighted by sharp one-day bounces but within the limits of an ascending or symmetrical triangle.
Solana price illuminated a rising wedge pattern that was nearing the apex during the steadfast rise as of yesterday. Today’s break below the wedge’s lower trend line triggered investors to fold their positions and capture profits. However, SOL has strongly rebounded and recovered the wedge’s lower trend line and the 50-day SMA, provoking a potential bear trap. It is an example of when daily closes can be tactically advantageous.
In general, a rising wedge is a bearish pattern that begins wide at the bottom and slowly contracts as the price moves higher. It can be a continuation pattern or a reversal pattern and is underlined by weakening volume.
If today’s rebound holds, it raises the probability that Solana price will resume the uptrend as more weak holders have now been flushed from the SOL investor base. The 61.8% retracement level at $43.00 and the 78.6% retracement level at $49.50 block the path to the all-time high at $58.39.
Additional targets will be more apparent once Solana price has reached the all-time high.
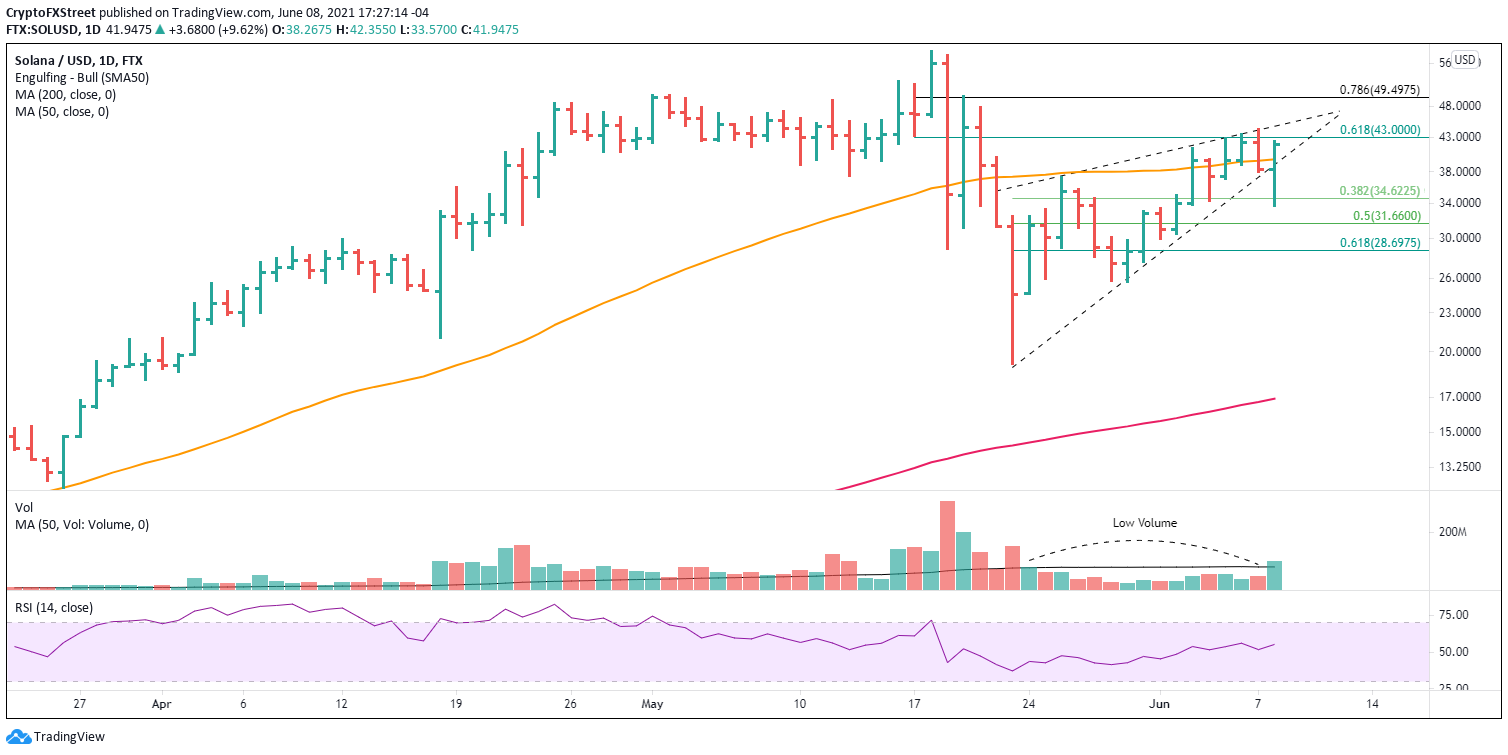
SOL/USD daily chart
A daily close below the 50-day SMA and the wedge’s lower trendline will re-introduce a bearish bias. Solana price support layers are the 38.2% retracement of the rally off the May low at $34.62, followed by the 50% retracement at $31.66 and lastly, the 61.8% retracement at $28.69.
Any SOL weakness beyond the May 30 low at $25.62 would provoke a new interpretation of the price structure and raise the probability that the May collapse was the first leg of a more significant corrective process.


