
 There are some hybrid analysis tools that well-informed CFD traders should pay careful attention to; they’re are a mixture of technical and fundamental analysis.
With these hybrid widgets and apps, you get the visual illustration that a technical indicator offers, combined with and supported by the fundamental reasons a trend develops.
The Admirals Heat Map is a real-time, hybrid analysis tool that all traders, whatever their levels of experience or skill, should consider applying to their trading method and strategy.
The widget is easy to follow and simple to activate, and it provides a snapshot of the financial instruments on the move and how much they’ve risen or fallen.
When the Heat Map gets used in conjunction with the Admirals sentiment index widget, traders can obtain an excellent visual representation of market behaviour.
The mapping is beneficial for day, swing and position traders who like to take a second look at all the available data and analysis before clicking the buy or sell button.
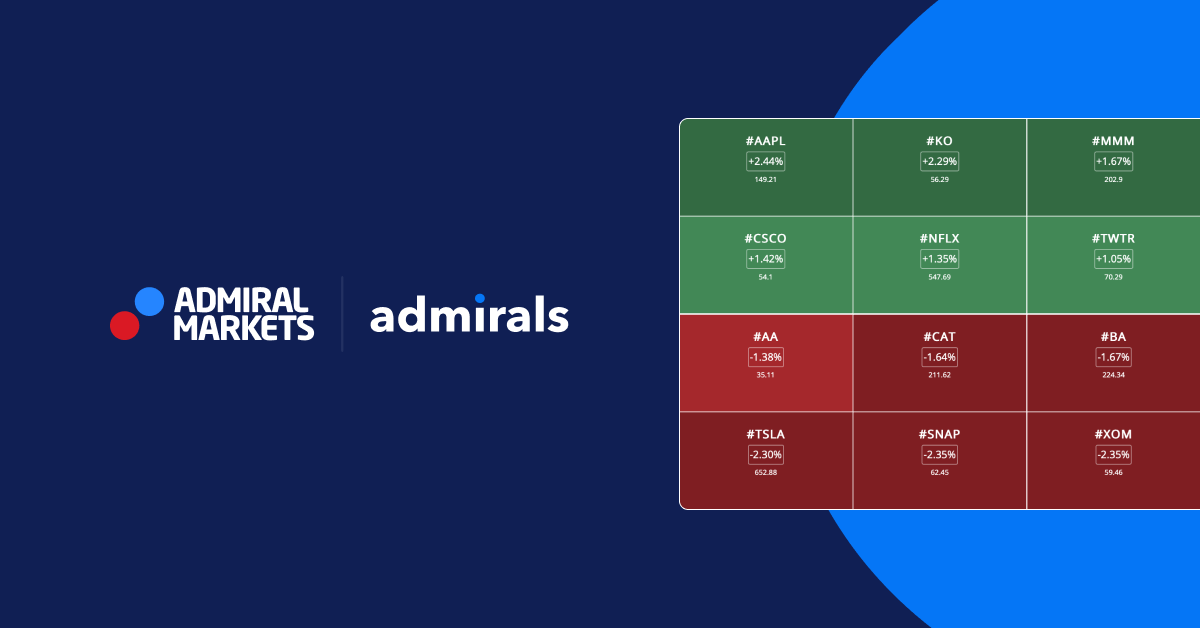
The widget illustrates the top daily movers in the equities market, information that can provide you with plenty of exciting trading opportunities.
Market movement always attracts interest from the trading community, both traders and investors; therefore, crowd behaviour could increase the current sentiment and the trade direction.
The directional movement can gain strength with increased volatility, and this is when the Heat Map lights up with suggestions.
If you’re considering trading the most popular equities, the Heat Map provides essential information to ensure you’re on the right side of the market when you make your trading decision.
If all your other analysis and trade execution criteria get met, the Heat Map can serve as your final decision-maker.
Key features and benefits
- You can use the market radar function to track price movements.
- View the most significant market movements and trends, to the upside and downside.
- Remain aware of both long and short trading opportunities.
- Daily trends, volatility and other vital metrics are visible on the Heat Map.
All the data used in the Heat Map gets harvested in real-time from the Admirals Flagship Trade.MT4 account.
Top Share Market Movers
The mapping highlights the top daily movers, saving you the time needed to screen several markets simultaneously, putting you in the ideal position to plan your trading decisions.
The mapping reveals the key movers over the past 24 hours and during the last trading session, enabling CFD traders to figure out the daily trend and analyse if a medium-term swing could develop.
If you’re looking to trade stocks, the mapping software delivers the name of the stock using its ticker, the current price and the percentage size of the rise or fall.
For example, on June 1, Microsoft (MSFT) fell by 0.92%, and the closing price was 247.32.
On the same day, Johnson & Johnson (JNJ) slumped by 2.20%, and the closing price was 165.53.
From a fundamental perspective, the falls were due to several reasons. The NASDAQ sold off as United States’ inflation fears still refuse to fade, and doubts surfaced concerning the efficacy of the latest JNJ one-time CV-19 vaccine and its acceptance.
Don’t miss opportunities.
Now the problem most retail traders have is that after spending considerable time poring over the data and research to arrive at their decision, the opportunity has gone; this is where the Heat Map can help you bank those profits.
You get instant notification of the rise or fall in real-time, and you can then quickly decide if there’s any momentum left in the movement.
You don’t have to over-analyse or procrastinate. The data is there in real-time, proving which stocks or FX currency pairs are on the move.
The Heat Map also works well in the FX market.
The mapping excels when used to gauge the movements of equities or FX currency pairs. Some charts reveal the most volatile pairs on the day.
Forex traders know how important it is to find which pairs are trading outside their most recent ranges; the Heat Map illustrates these patterns very effectively.
The mapping comes in the form of a blotter. You can quickly establish which pairs have moved outside their earlier range and how much in percentage terms.
Like the software used to highlight stock moves, the most volatile currencies are shown for the latest session and over the past 24 hrs. But the FX mapping goes a stage further to illustrate 48 hr movements and the complete two-day cycle.
In summary, the Heat Map provided by Admirals is another winning tool in their recently expanded box. Used in the right way, it can aid your trading decisions.
It’s not a standalone feature. The full range of benefits gets unlocked if you use it as part of a comprehensive fundamental and technical analysis strategy.
Used with the Admirals sentiment tool, and when combined with other technical indicators, while remaining aware of the fundamentals of a stock or FX pair, should put you in the ideal position to capitalise.
https://admiralmarkets.com/analytics/market-heat-map
About Admirals
Founded in 2001, Admirals is a multi-award-winning online financial broker offering competitive spreads and low commission charges. Admirals offer trading in Forex and CFDs on multiple products, including energies, stocks, bonds, ETFs, indices, and metals.
Through Admirals, traders can access high-tech platforms such as MetaTrader 4 and 5 on the web, mobile, and desktop for the ultimate trading experience. The mobile platforms are enhanced for iOS and Android, and clients can also access a proprietary plug-in called MetaTrader Supreme Edition.
Admirals’ clients get free access to webinars, seminars, and videos. Clients can trade from 150 countries and select from a wide range of accounts based on the software platforms clients prefer, their experience and their financial circumstances.
As a regulated broker, Admirals have approval and licenses in many jurisdictions, including Financial Conduct Authority (United Kingdom), Cyprus Securities and Exchange Commission (Cyprus), Financial Supervision Authority (Estonia), Australian Securities and Investments Commission (Australia), Financial Services Authority of Seychelles (Seychelles).
Clients can fund their accounts through Credit/Debit Card, Bank Wire Transfer, PayPal, Skrill, Union Pay, Neteller, AstroPay, and Trustly.
Admirals Review
Monday, 26 Jul, 2021 / 10:26


