
- THORChain price triggers doji candlestick pattern this month with a breakout above $7.75.
- Yearn.Finance price is now within striking distance of the formidable resistance defined by the 2020 high of $43,915.
- DeFi dominance of the cryptocurrency market is up 20% from the July low and 14% from the symmetrical triangle breakout on July 31.
THORChain price is being restricted by the resistance formed by the 200-day simple moving average (SMA) for the fourth time since June, preventing it from building on the 220% gain from the July low. Yearn.Finance price reached the first overbought reading since May, prompting a consolidation along the 200-day SMA. As a result, each DeFi coin is in a position to surprise to the upside in the coming weeks.
DeFi explodes off the July low, taking the leadership reins
The decentralized finance (DeFi) space has regained the swagger that dominated the first few months of 2021, highlighted by the 500% rise in Terra price since the July low, positioning LUNA as the second-largest DeFi token by market capitalization at just over $12 billion.
Overall, the total DeFi market capitalization has spiked 80% from the July low, yielding a value of $118.97 billion. However, the total market capitalization still remains well below the May 11 high of $149.66 billion.
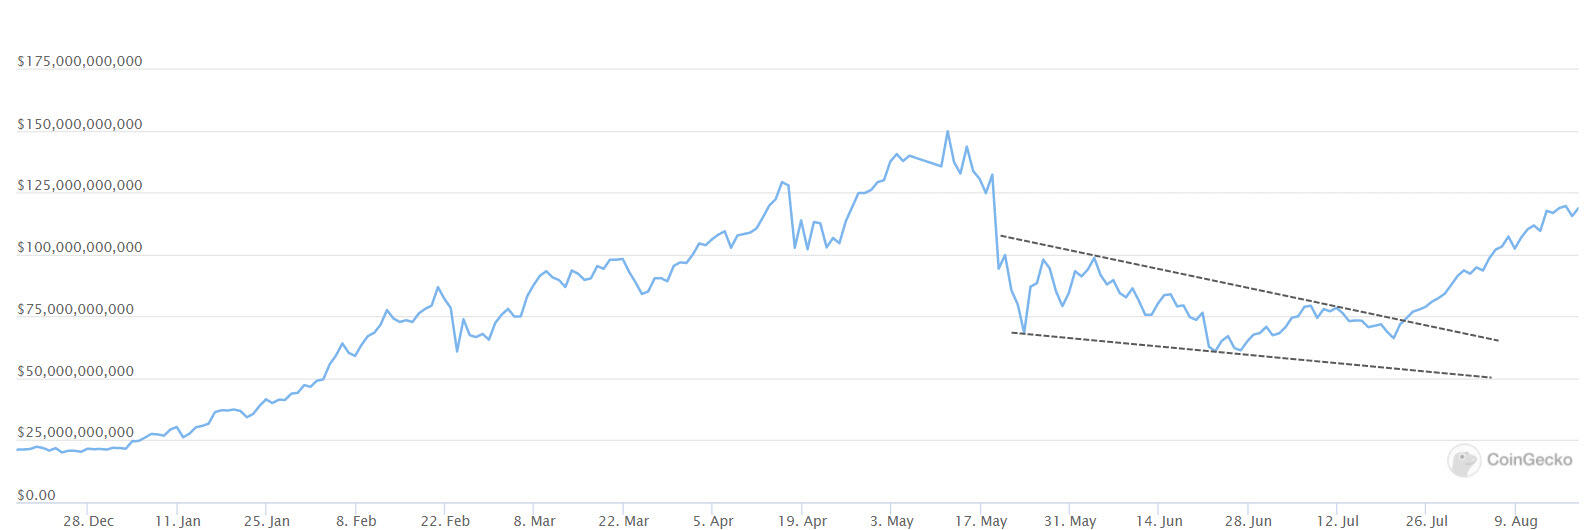
DeFi market capitalization – CoinGecko
The DeFi cryptocurrency market dominance has climbed from 4.86% at the July low to today’s value of 5.82%, breaking from a descending triangle pattern, reclaiming the 200-day SMA and registering an overbought condition on the daily Relative Strength Index (RSI). Similar RSI readings in 2021 have preceded minor pullbacks.
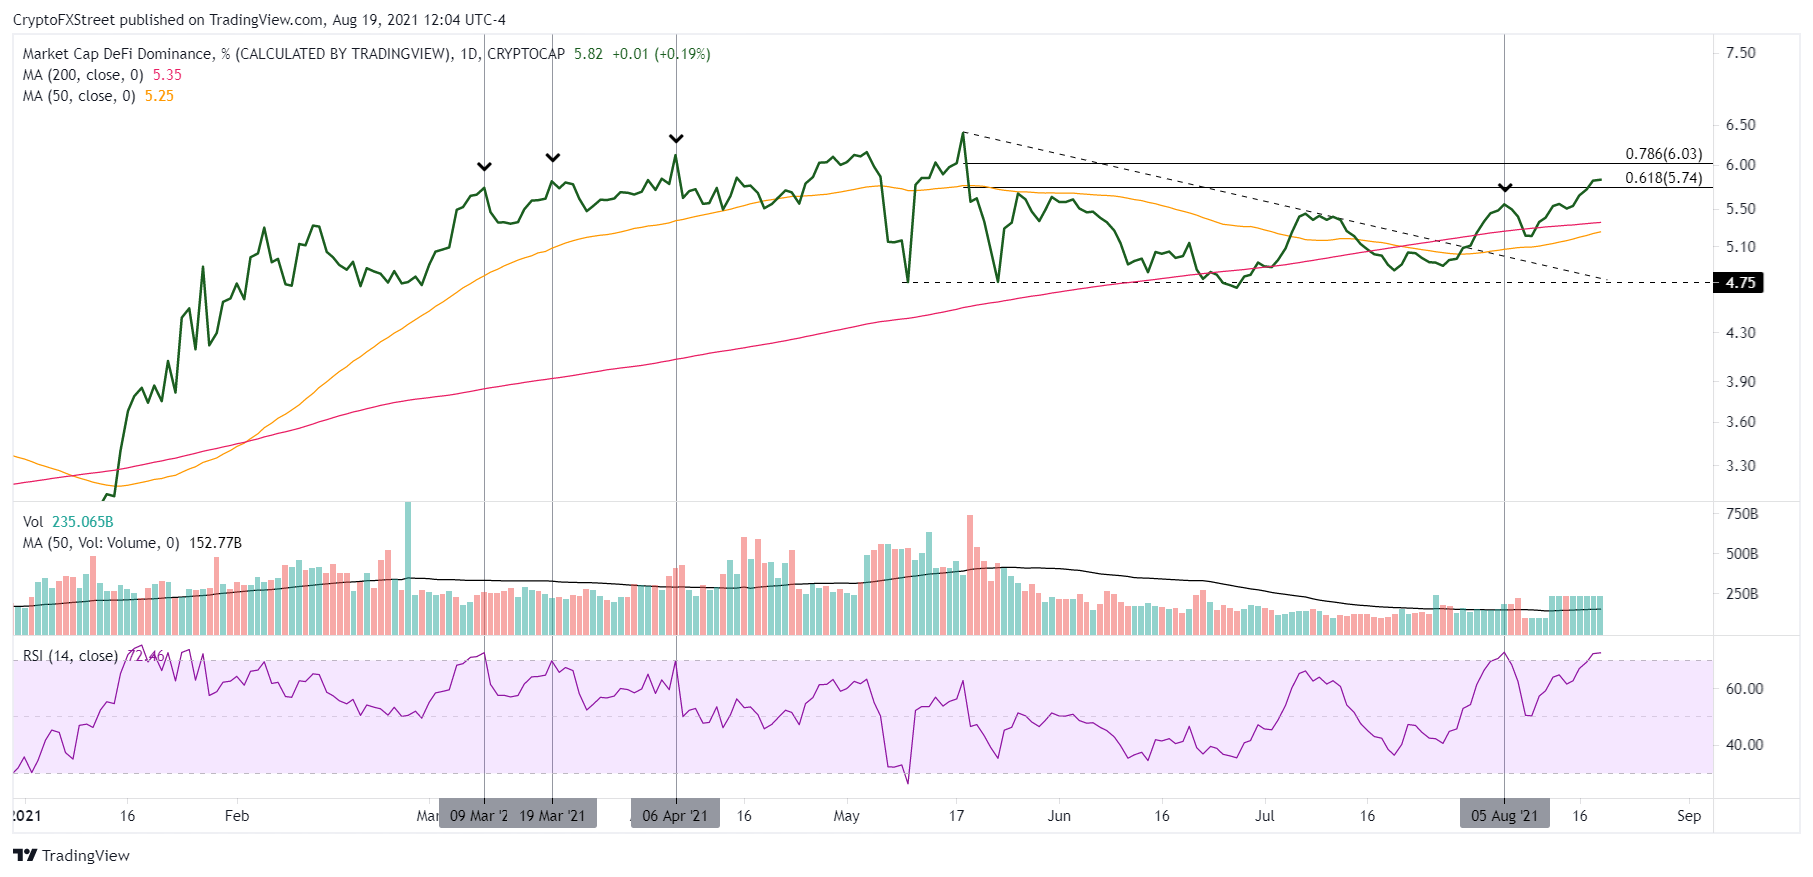
DeFi market dominance – daily chart
DeFi digital assets have taken a leadership role in the altcoin revolution, turning previously unknown tokens into FOMO magnets. Two DeFi digital assets, RUNE and YFI, have benefited from the renewed spirit for the decentralized finance space but are now encountering short-term resistance at the strategically important 200-day SMA.
THORChain price recovery has been impulsive
THORChain price has climbed 225% from the July 20 low, positioning RUNE at the 200-day SMA at $8.48 after a brief attempt to rally above. It is the fourth time that the altcoin has stumbled at the moving average since June, but THORChain price has confirmed the July low with the rally above the doji candlestick pattern high at $7.75 plotted on the monthly chart in July. The doji candlestick preserved the secular advance from 2019.

RUNE/USD monthly chart
Moving forward, THORChain price will continue to consolidate around the 200-day SMA, clearing the weak holders before pursuing higher prices.
To confirm the next leg higher for RUNE, it needs to record a daily close above the topside trend line beginning in June at $9.70. If successful, the cryptocurrency will quickly meet resistance at the 38.2% Fibonacci level at $10.31, followed by the 50% retracement at $12.57. The 61.8% retracement at $14.83 will be a challenge as it aligns with two significant highs on May 20 and May 27. A rally from the current price to the 61.8% retracement would deliver a 70% return to investors.
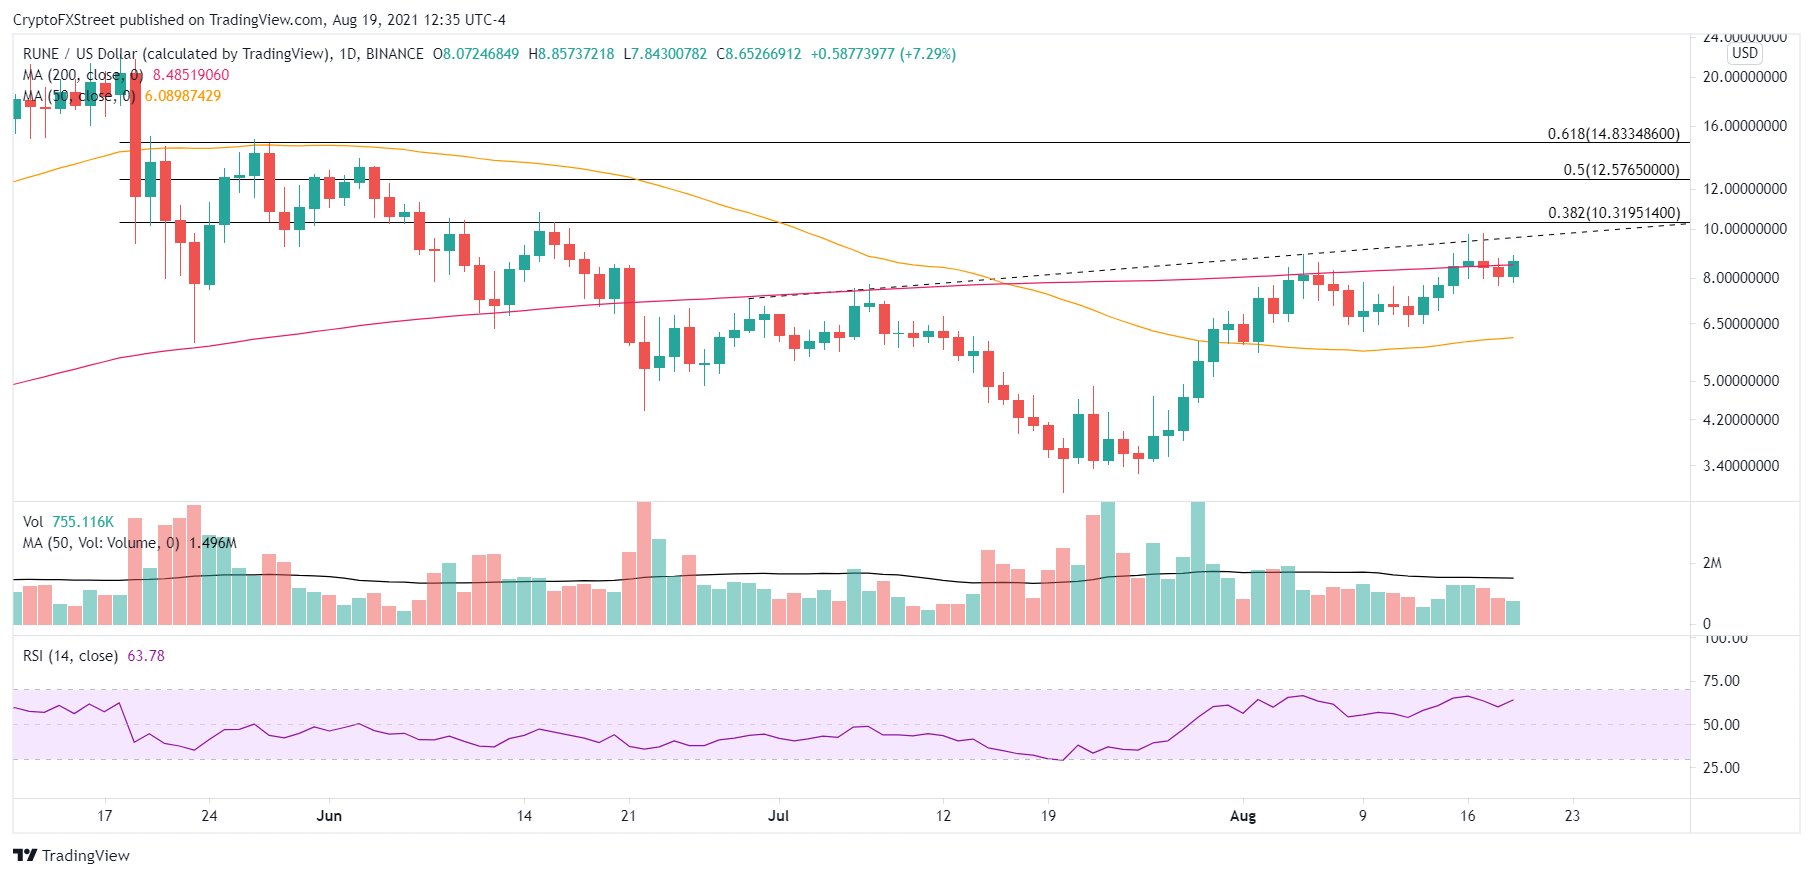
RUNE/USD daily chart
The bearish alternative has THORChain price failing at the combination of the topside trend line and the 200-day SMA and falling to the 50-day SMA at $6.08, which closely corresponds to the August 9 low of $6.27. A RUNE pullback to the 50-day SMA would yield a loss of 29% from the current price.
THORChain price enjoyed a significant rally from the July low before locating resistance at the 200-day SMA. However, the RUNE price structure does not suggest that the rebound is complete. Instead, THORChain price is in consolidation, turning the 200-day SMA from resistance to support. Adding to the upside potential, RUNE did not reach an overbought reading on the daily RSI, creating more space for the next rally leg to develop, overcoming the negative sentiment associated with three recent hacks.
Yearn.Finance price builds energy for next leg higher
Yearn.Finance climbed 70% from the July low and triggered a double bottom pattern on August 11. YFI has been not logged a sustainable follow-through, opting for consolidation along the 200-day SMA at $39,368 after registering an overbought reading on the daily RSI for the first time since May.
The measured move of the double bottom pattern is just over 34%, establishing a YFI profit target of $50,725. The target falls slightly below the 38.2% retracement level of the correction at $51,065 and a series of Yearn.Finance highs printed in late May.
The 200-day SMA should serve as the foundation for YFI rally to the profit target, propelling Yearn.Finance price above the 2020 high of $43,915
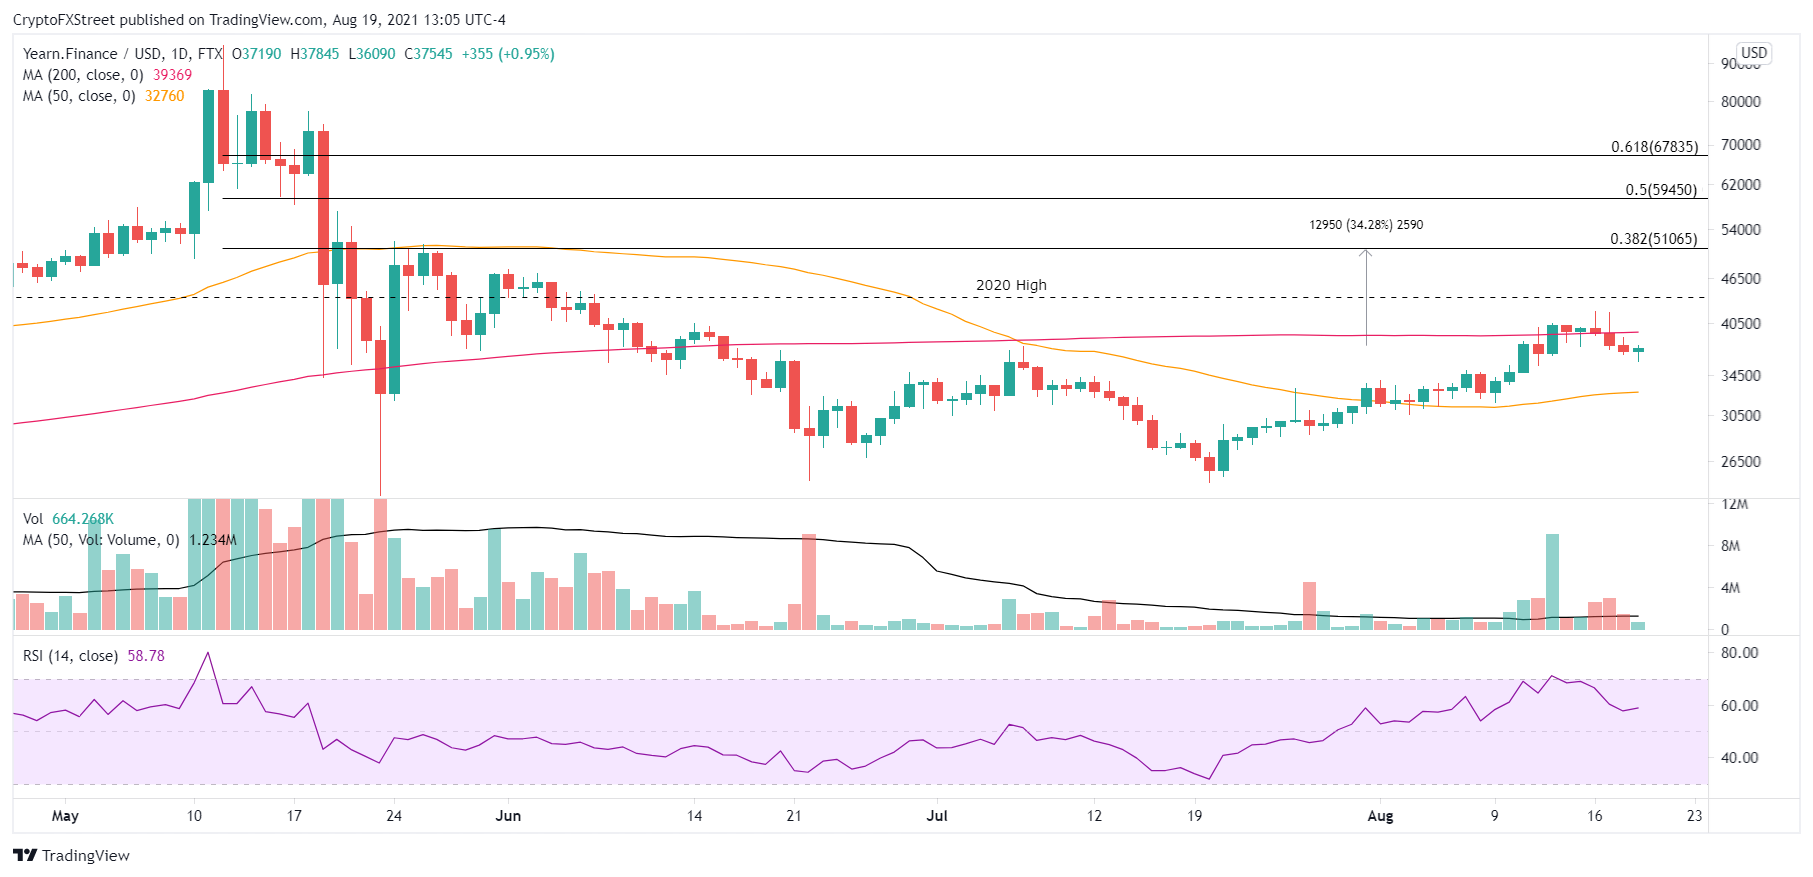
YFI/USD daily chart
If the 200-day SMA at $39,368 becomes impossible to overcome, Yearn.Finance price will pull back to the 50-day SMA at $32,757, representing a 13% decline from the current YFI price. Nevertheless, it will not mark the end of the rally or void the bullish narrative. Only a daily close below the 50-day SMA would weaken the outlook.
YFI and RUNE have enjoyed important rallies from the July low and are confronting the resistance associated with the 200-day SMA. It is an obvious point for a pullback and does not diminish the strength of the two price structures. With the momentum accelerating in the decentralized finance space, the 16th and 18th ranked DeFi tokens are poised to surprise with higher prices due to the resets occurring at the strategically important moving average.


