
- Uniswap price tagged an important retracement level of the May-July correction.
- The Graph price races almost 90% in less than four weeks before revealing a bearish candlestick pattern.
- DeFi Pulse Index confirms breakout from an ascending triangle pattern with a 19% gain.
Uniswap price has tapped the 50% retracement level of the May-July correction while showing a bearish momentum divergence on the intraday and daily charts. The Graph price reaches significant resistance after an explosive move and closes with a bearish shooting star on the daily chart.
Biggest DeFi hack rocks the space
On August 10, in the biggest hack in decentralized finance history, hackers stole about $600 million in cryptocurrencies from PolyNetwork, a DeFi platform. The stolen assets included $273 million of Ethereum tokens, $253 million in tokens on Binance Smart Chain and $85 million in USDC on the PolyNetwork. Tether was the only entity that acted quickly and blacklisted the stolen USDT on Ethereum worth approximately $33 million.
DeFi apps have attracted billions in investor funds this year but have also been the target of frequent hack attempts. DeFi-related hacks constituted more than “60% of the total hack and theft volume.” This is up from only 25% in 2020, and in 2019 the DeFi hacks were virtually non-existent.
The hackers have begun returning the stolen cryptocurrency from the DeFi protocol, PolyNetwork, stating they should be rewarded for returning the funds and exposing the bug in the computer code.
DeFi Pulse Index pauses near May highs
The DeFi Pulse Index is a digital asset index that tracks tokens’ performance within the decentralized finance industry. The index is capitalization-weighted and is focused on the projects in decentralized finance that have notable usage and show a commitment to ongoing maintenance and development.
The index began in September 2020 and consisted of the most popular DeFi token available on Ethereum, including COMP, YFI and MKR, permitting investors to buy a single ERC-20 token to get exposure to all ten tokens in the index.
From a technical analysis perspective, the DeFi Pulse Index plummeted 70% from the May high of $662.43 to the June low of $197.46, erasing most of the 2021 gains. However, the release from an ascending triangle pattern earlier this month has pushed the Index nearly 19% before closing in on resistance defined by the May 27 high of $424.10 and June 3 high of $416.91. The measured move of the triangle pattern is over 40%, with a price target of almost $500.00.
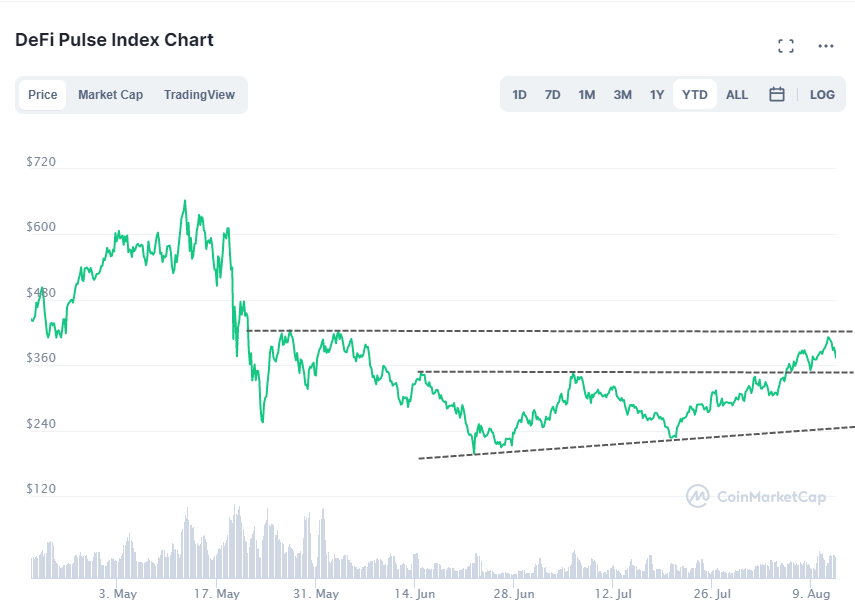
DeFi Pulse Index – CoinMarketCap
Ascending triangles are categorized as a bullish formation that forms during an uptrend as a continuation pattern. Still, examples like the DeFi Pulse Index form as reversal patterns at the end of the downtrend. The ascending triangle pattern, whether continuation or trend reversal, indicates accumulation as the reaction lows rise.
The breakout and rally from the ascending triangle pattern have carried the DeFi Pulse Index near important resistance, suggesting the beginning of a corrective process in the space.
Uniswap price primed for a pullback after 100% gain
Uniswap price broke out from a symmetrical triangle pattern on July 30 and rallied to the 50% retracement of the May-July correction at $29.01. The UNI high of the rally also coincides with resistance-associated with highs printed in late May and early June but falls slightly below the triangle’s measured move price target of $31.66.
The most recent UNI high was matched with a bearish momentum divergence on the intraday and daily charts, pointing towards a pullback for Uniswap price in the short term.
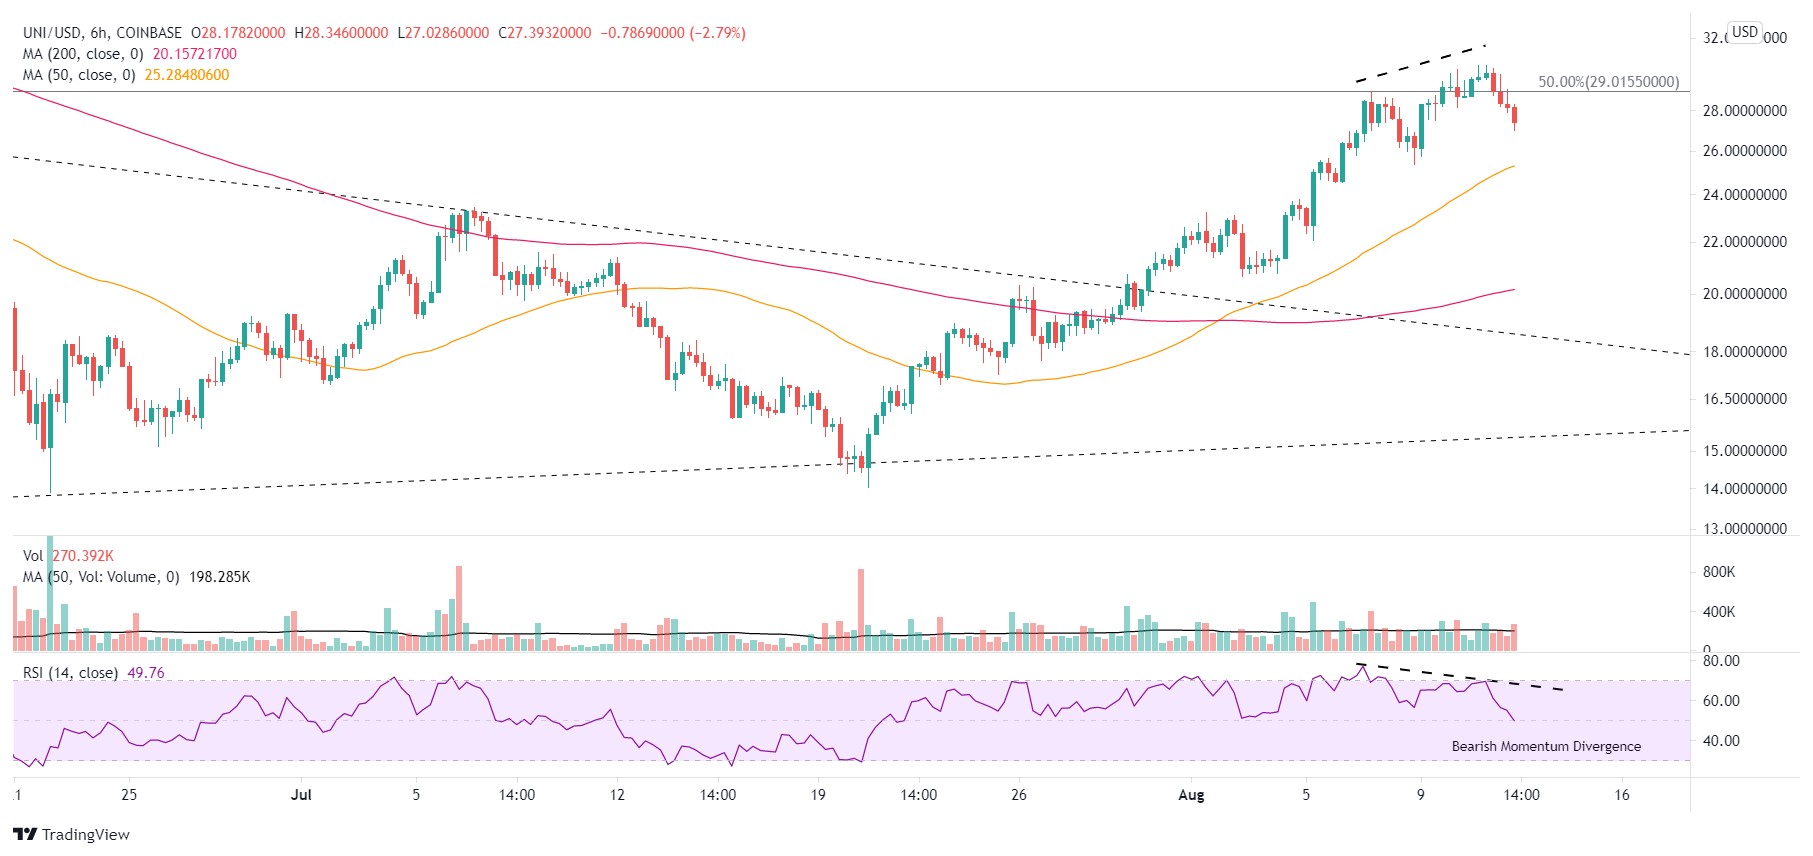
UNI/USD 6-hour chart
The correction could unfold in time or price. If it is in time, Uniswap price should discover solid support along the 200-day simple moving average (SMA) at $26.11. However, if the UNI consolidation is hit by selling pressure, it may locate support at the July 7 high of $23.45. Compelling support does not arrive until the rising 50-day SMA at $20.30.
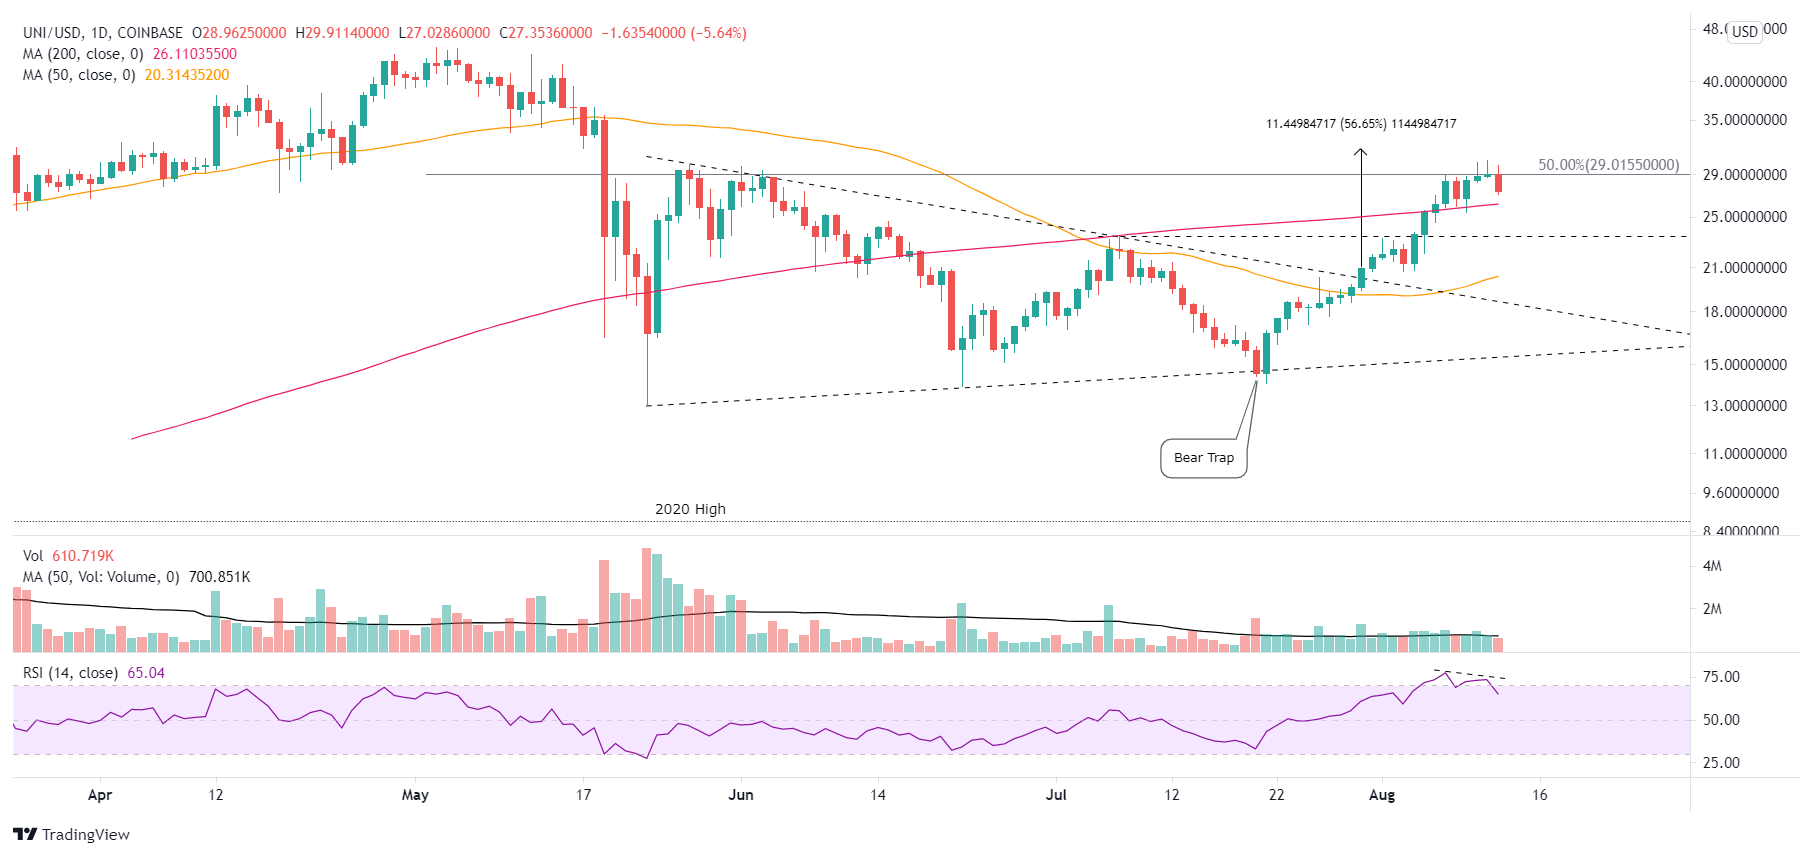
UNI/USD daily chart
The combination of the 50% retracement resistance, the 100% gain in four weeks and a bearish momentum divergence on multiple timeframes should introduce a Uniswap price correction. The type of consolidation and depth is unknown, but UNI investors should not target new purchases at the moment.
The Graph price greets 2020 high with a reversal
The Graph price climbed 87% from the July 21 low to yesterday’s high. The rally attempted to surpass the resistance established by the 78.6% Fibonacci retracement of the 2021 rally at $0.803. However, it reversed the early GRT gains and closed the session below the retracement level and recorded a bearish shooting star candlestick pattern.
The 78.6% retracement level has been stubborn resistance for a few months, rejecting GRT rallies in July, in mid-June and at various points in May. The level converges with the 2020 high of $0.810, presenting a bigger challenge for The Graph price bulls.
Based on the price structure, The Graph price correction may reach the 50-day SMA at $0.627 due to the lack of credible support below GRT.
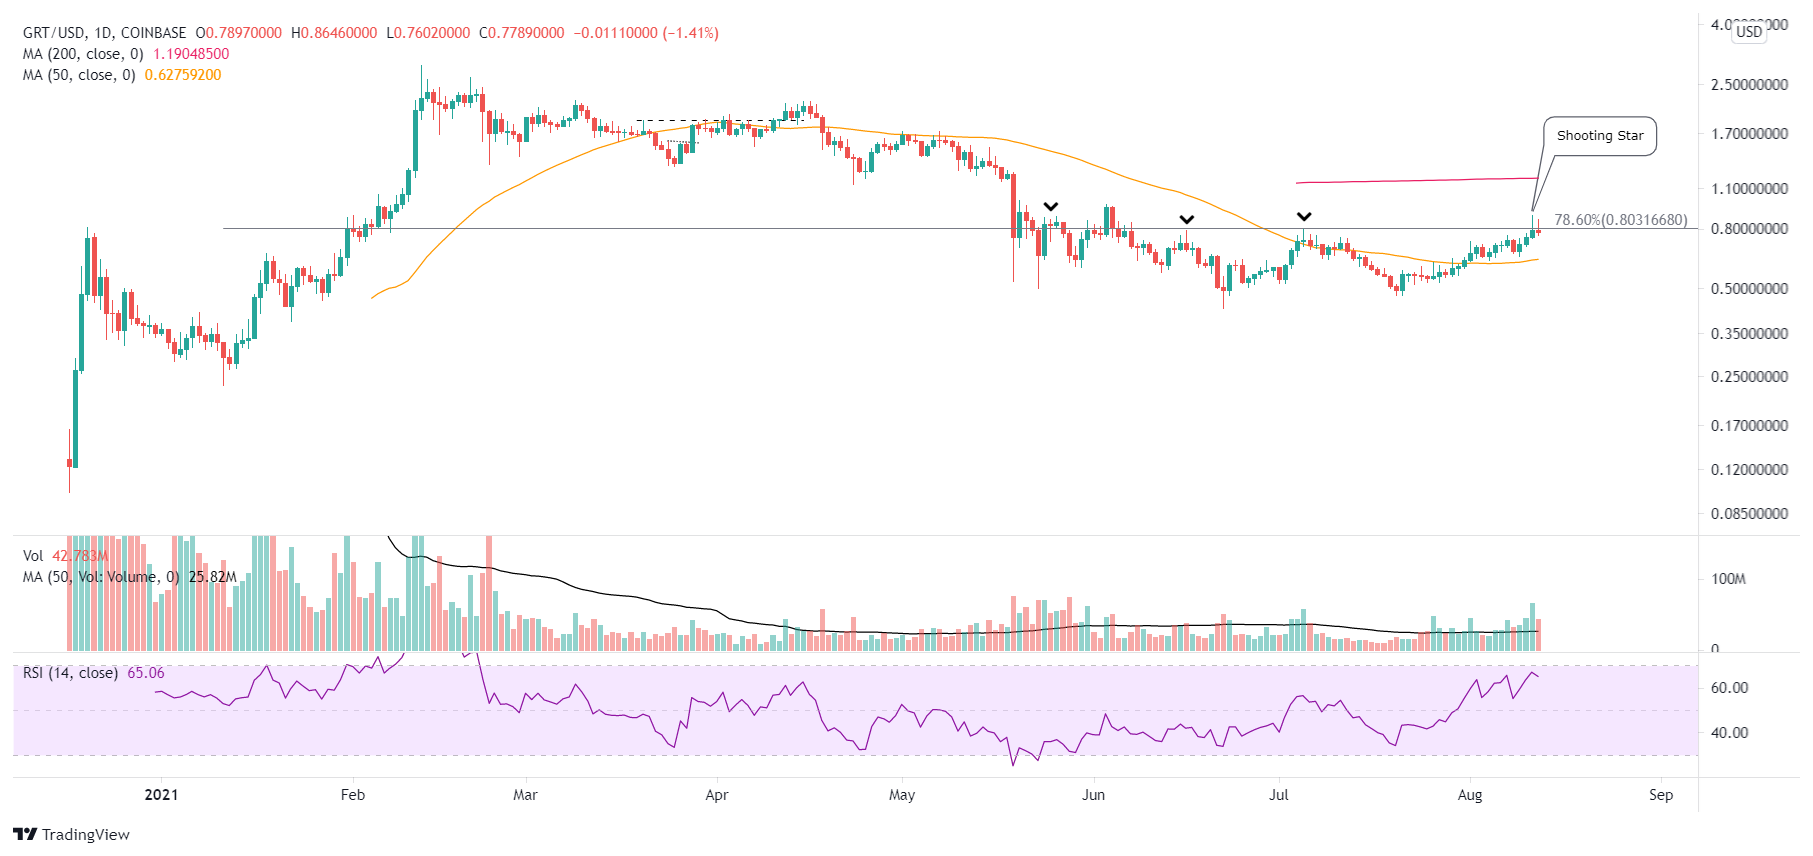
GRT/USD daily chart
The DeFi space was impacted by the biggest hack in the world of decentralized finance. Still, DeFi cryptocurrencies were extended in many cases, bumping into crucial resistance levels or revealing bearish technical observations.
UNI and GRT are two tokens that have reached short-term inflection points with probabilities stacked in favor of a downward resolution. Nevertheless, the DeFi Pulse Index breakout from an ascending triangle pattern demonstrates the investor commitment in the space moving forward.


