
- Shiba Inu price action reveals an Adam and Eve pattern in play, hinting at a breakout soon.
- Investors can take advantage of the 75% rally to $0.0000454.
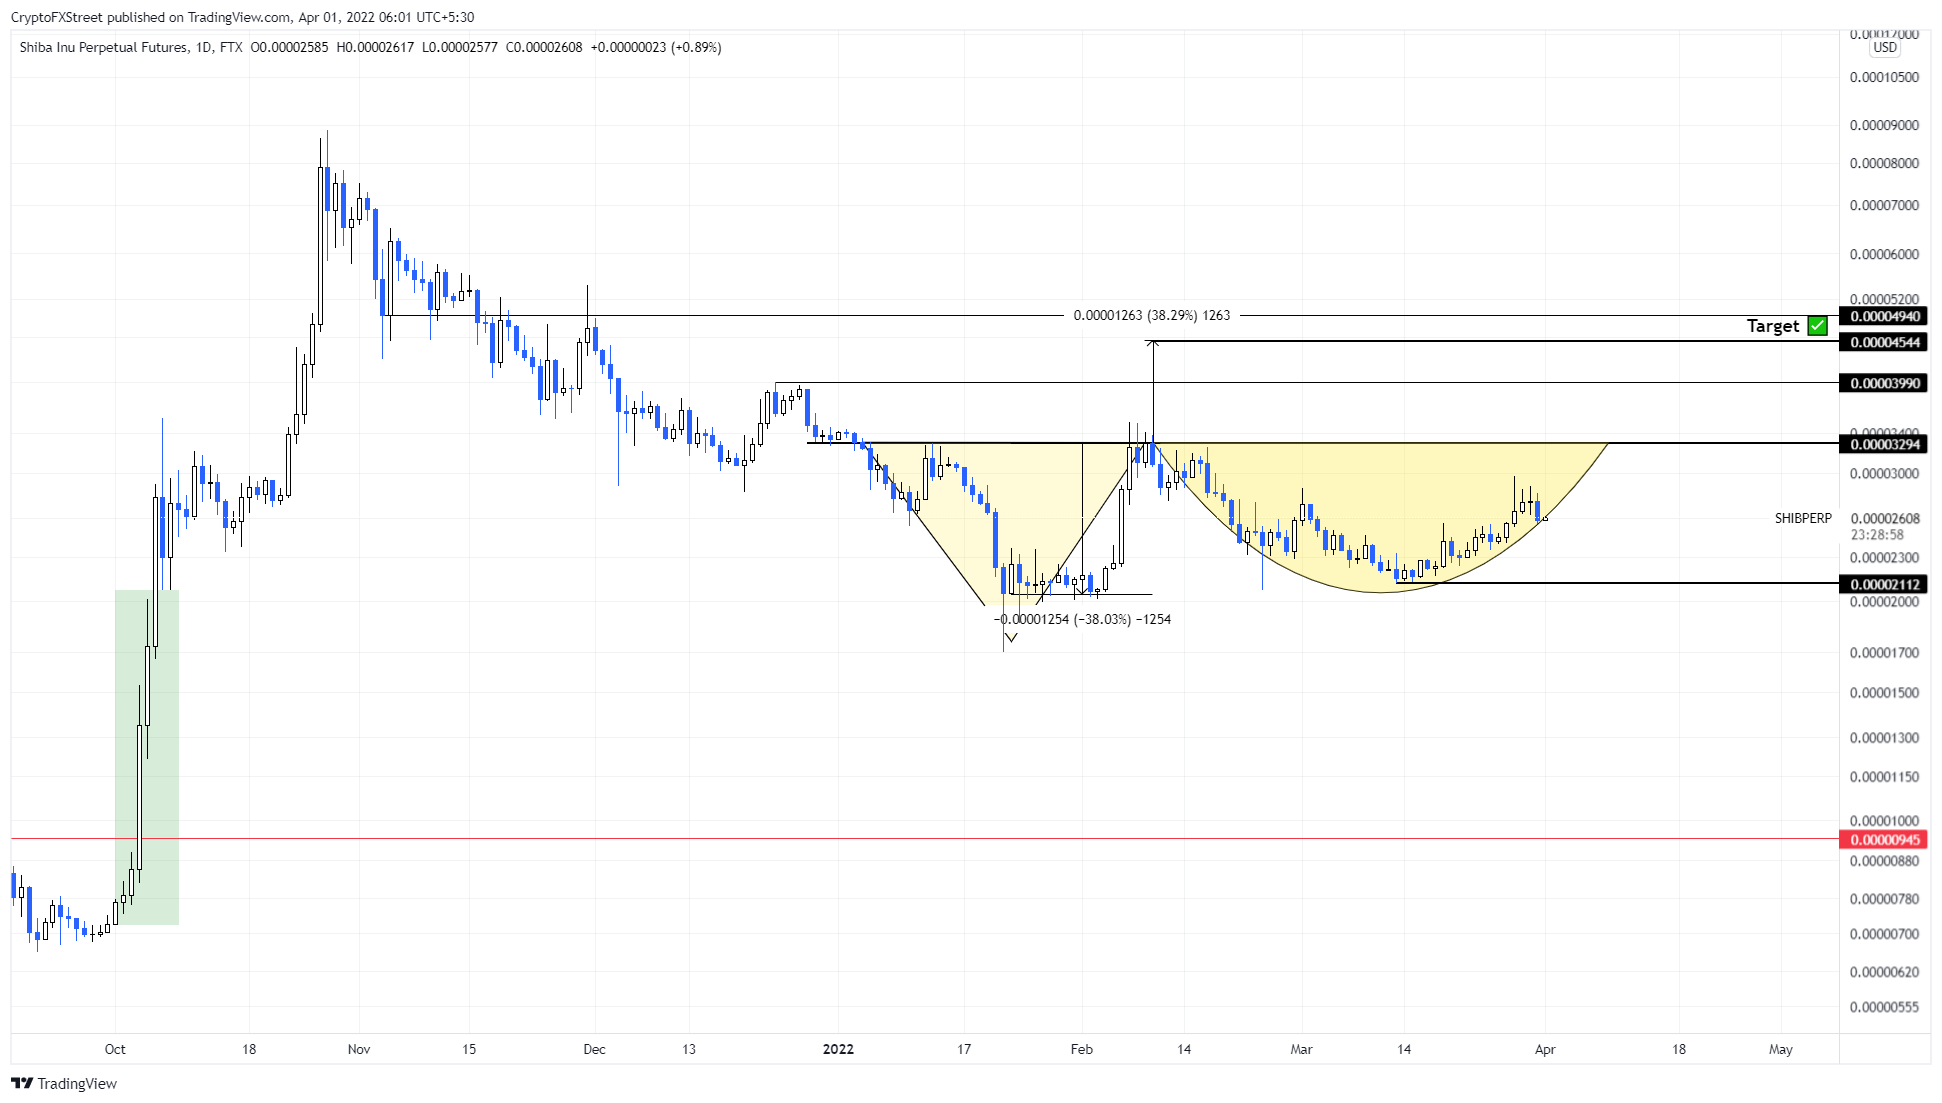
- A daily candlestick close below $0.0000212 will invalidate the bullish thesis for SHIB.
Shiba Inu price set up a bottom reversal pattern on the daily chart, signaling a massive up move. However, the recent downtick in Bitcoin’s price has caused rallying altcoins to take a break.
Shiba Inu price sets a launchpad
Shiba Inu price action from January 5 to February 8 set up a V-shaped valley known as “Adam.” This move was followed by a rounded bottom formation referred to as “Eve”. While the second half of the pattern is still in play, investors can expect the setup to continue to completion.
The Adam and Eve formation is a bottom reversal pattern and forecasts a 38% upswing, determined by measuring the depth of the valley and adding it to the breakout point at $0.0000329.
Based on the theoretical forecasting methods, SHIB is likely to revisit the $0.0000329. From the current position, this move would constitute a 75% ascent. Shiba Inu price will also face a temporary hurdle at $0.0000399, where bulls need to band together to overcome it and reach the target.
SHIB/USDT 4-hour chart
Regardless of the bullish outlook for Shiba Inu price, Bitcoin can easily turn the setup into a stalemate if it heads south without a warning. So, investors need to exercise caution.
A daily candlestick close below $0.0000212 will invalidate the bullish thesis for Shiba Inu price. This development will create a lower low and shift the odds in the bears’ favor and potentially trigger a 55% crash to $0.0000094.


