
- Tezos price has recovered inside the ascending triangle, hinting at a 29% upswing.
- Investors need to note that the breakout above $1.67 has not occurred yet.
- A four-hour candlestick close below $1.33 could trigger a 29% crash to $1.07.
Tezos price consolidates between a horizontal high-time-frame resistance barrier and an inclining support level, forming a bullish pattern. The recent fakeout lured many investors to short, but the recovery suggests that XTZ is vying for a bullish move.
Tezos price reveals its intention
Tezos price flipped the $1.67 support level into a resistance barrier as it crashed 33% between June 12 and June 18. This move was followed by a set of higher lows and equal highs, which when connected using trend lines result in an ascending triangle.
This technical formation forecasts a 29% upswing to $2.16, determined by adding the distance between the first swing high and swing low to the breakout point at $1.66. Interestingly, XTZ price moved below the lower trend line on July 12, indicating a bearish breakout.
However, this move was a fakeout, which is a classic formation that lures unbeknownst traders. Regardless, the recovery has pushed Tezos price up by 8% and above the 200 four-hour Simple Moving Average (SMA), further confirming the trend’s strength.
Going forward, investors can expect a four-hour candlestick close above the $1.66 hurdle, suggesting a breakout and the start of the larger move to $2.16.
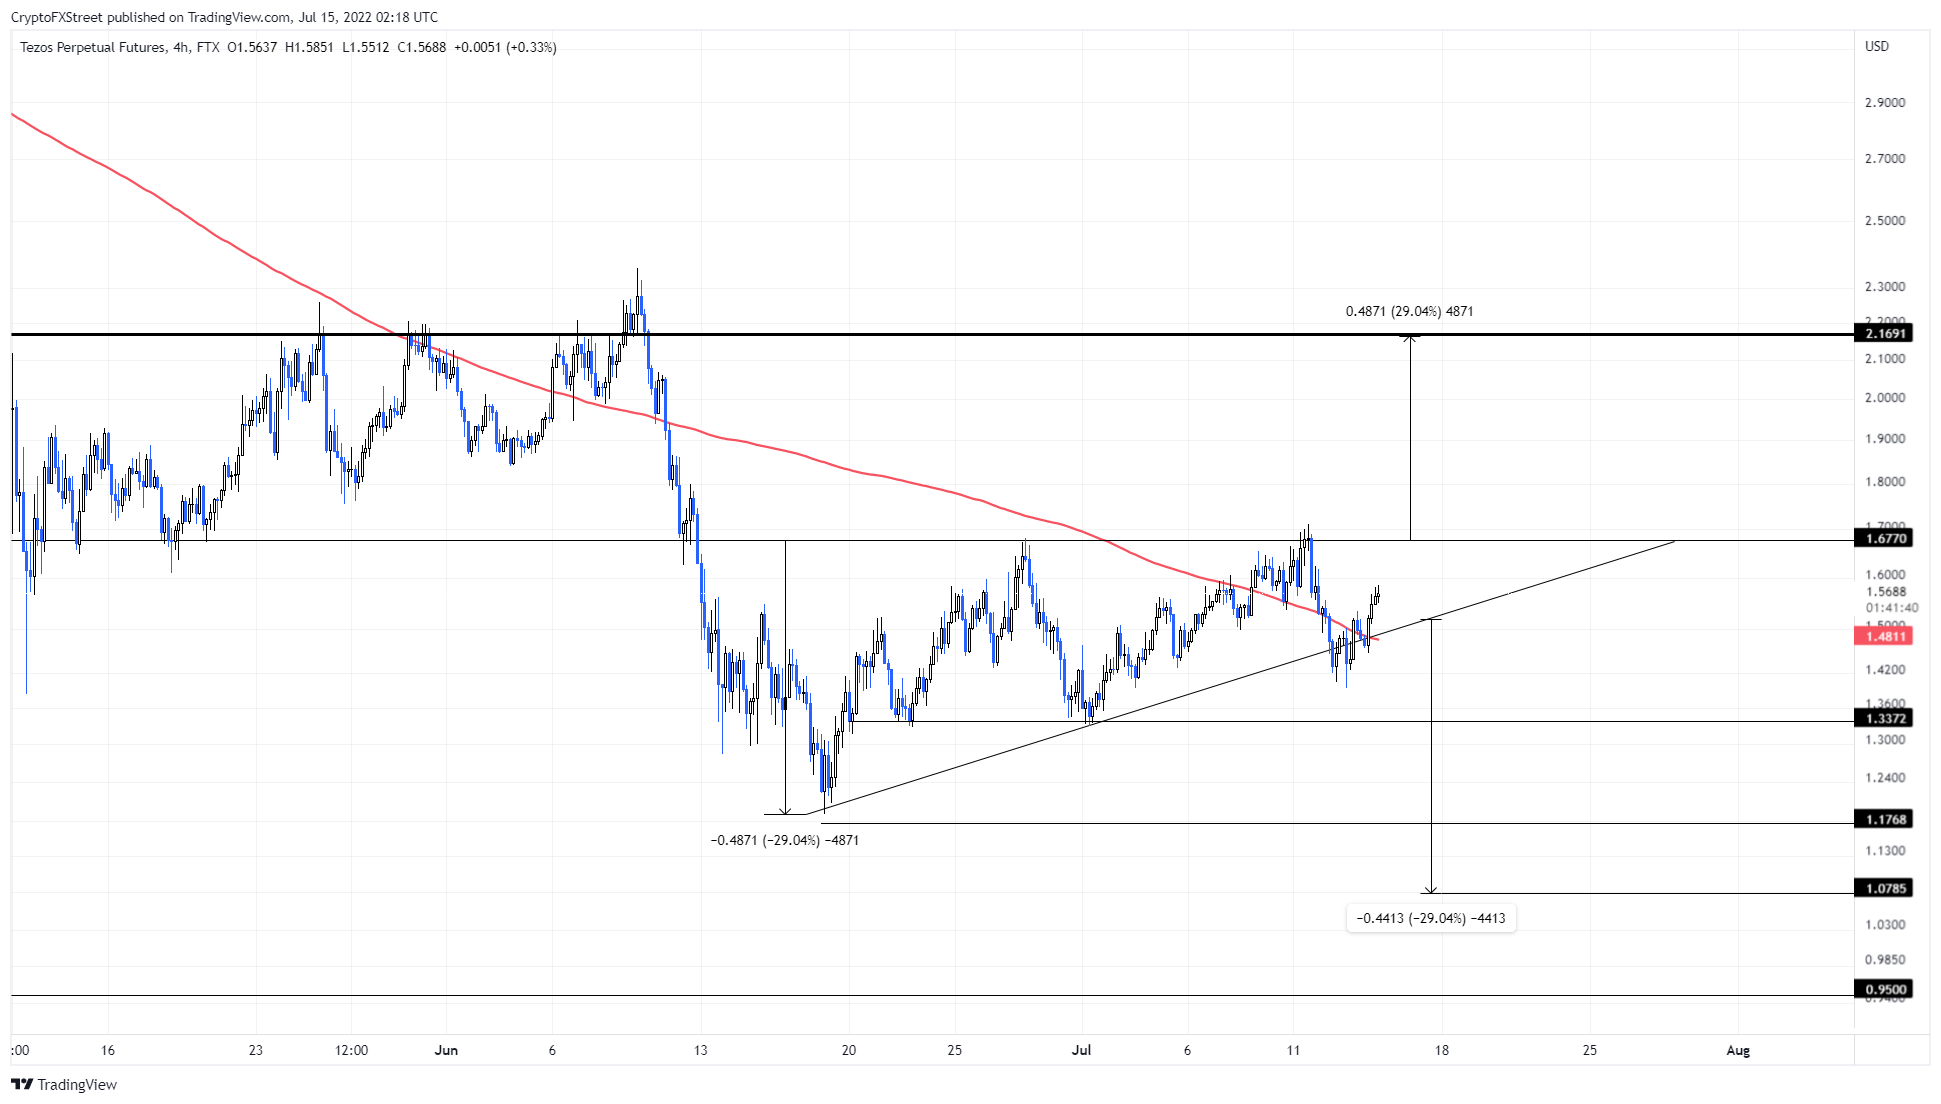
XTZ/USDT 1-day chart
On the other hand, if Tezos price flips the $1.33 support level into a resistance barrier, it will invalidate the bearish thesis. In such a case, XTZ price could trigger an 18% correction to $1.07.


