
- Bitcoin price logs ten consecutive up days, yielding a 41.76% return and closing last week up 12.52%.
- Ethereum price closed last week up 16.53% and finished July with a gain of 11.29% after being down 24% at the July 20 low.
- XRP price stalls at formidable resistance after triggering a double bottom pattern.
Bitcoin price ends three-month decline with a compelling 18.35% gain in July while Ethereum price is working on a historic 13 consecutive up days. XRP price closed last week with the best weekly return since the end of April.
Bitcoin price realizes the weight of the quadfecta of resistance
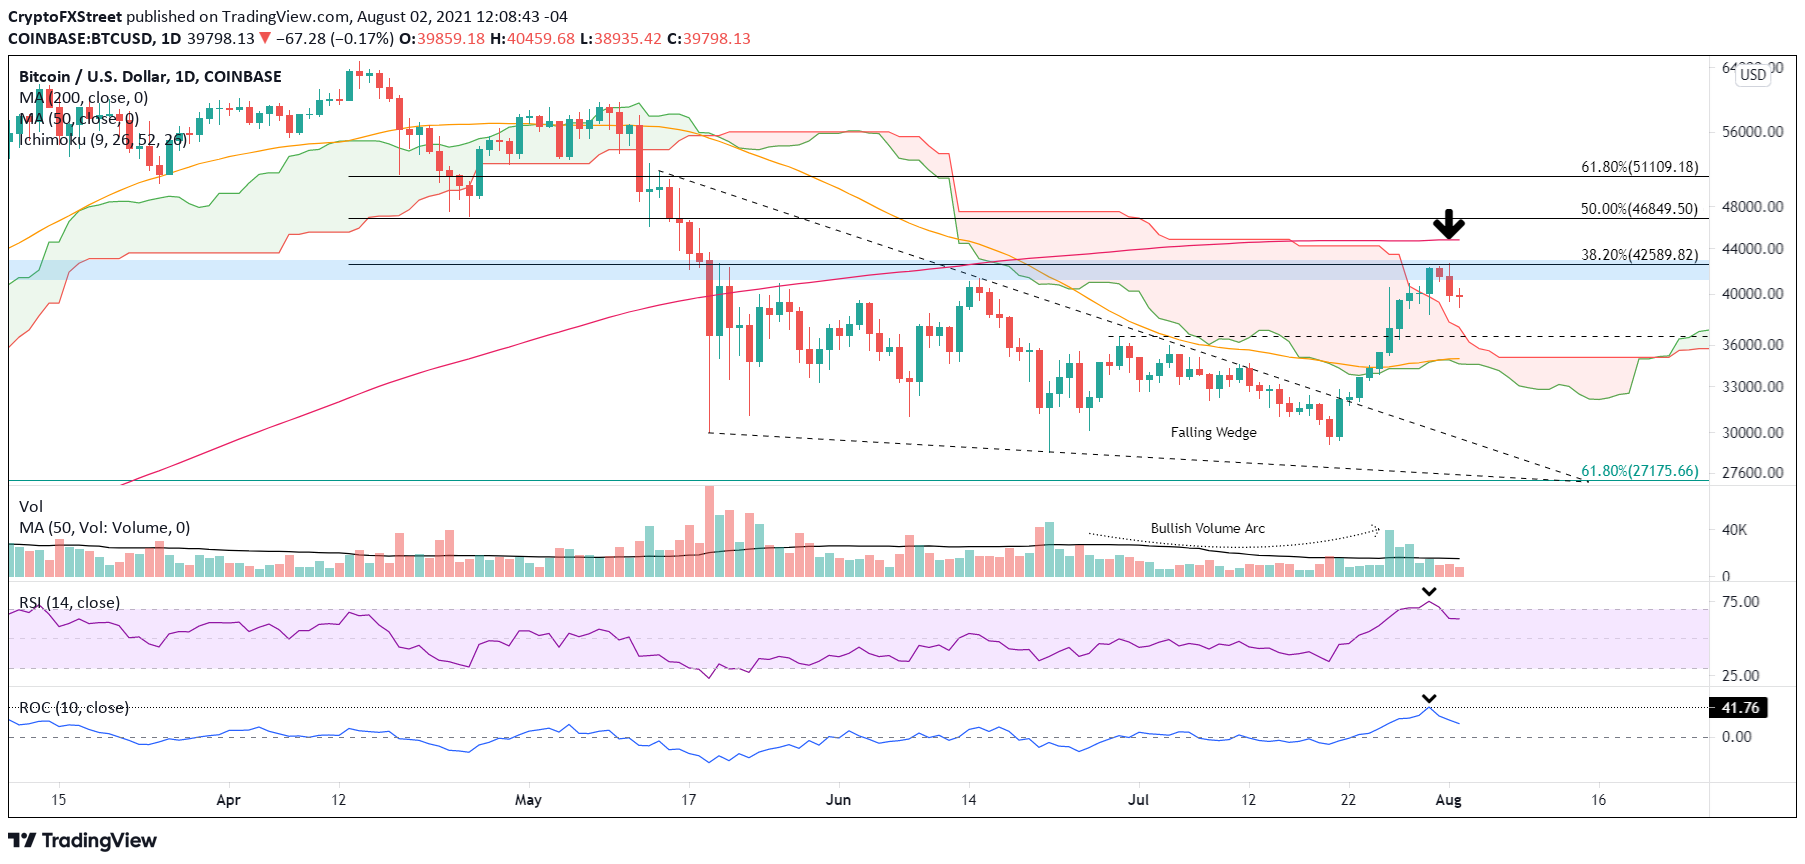
Over ten days, from July 21 to July 30, Bitcoin price rallied 41.76%, marking the best ten-day period since the February gain of 43.14% and the January gain of 48.60%. However, it is the most profitable rebound off a major low since the February 2018 gain of 46.80%. Similar BTC gains occurred during established advances and often marked a local top or the final high.
There is no doubt that Bitcoin price has formed an impulsive rebound that notably deviates from other major lows due to the magnitude of the gain and sustainability. It is essential to note the comparative from 2018 was just an oversold bounce after the first leg lower from the 2017 high. BTC did go on to a major decline before finally bottoming in December 2018. Thus, investors should be mindful of that precedent as the flagship cryptocurrency confronts heavy resistance.
The magnitude and sustainability of this rally pushed Bitcoin price to a quadfecta of resistance that is now influencing BTC and may continue for several days or weeks. The first resistance point is the Ichimoku Cloud that was surpassed on July 30 after two days of struggle. Beyond the Ichimoku Cloud is the June 15 high of $41,322, the 38.2% Fibonacci retracement of the April-June correction at $42,589 and the February 28 low of $43,016. Combined, those final three levels are now being engaged by Bitcoin price with negative results.
As was mentioned late last week, the optimal scenario for Bitcoin price is a correction in time, meaning BTC moves sideways with a mild downward drift, releasing the overbought condition that is now evident on the daily Relative Strength Index (RSI) but sustaining the current gains and momentum. It would be a clear sign of a robust underlying bid and the presence of long-term directed investors.
If the current pause evolves into a meaningful pullback, the valid BTC support begins with the confluence of the June 29 high of $36,675 with the Ichimoku Cloud. Suppose the Bitcoin price level fails to restrict the selling pressure. In that case, the now-rising 50-day simple moving average (SMA) at $34,957 should successfully defend against any further weakness, presenting a 12% loss from the current price and a fall of 18% from the August 1 high of $42,605.
Any weakness below the tactically important 50-day SMA would require reassessing the bullish narrative outlined by the Bitcoin price action since the July 20 low.
BTC/USD daily chart
A renewal of buying pressure will find some resistance at the strategically important 200-day SMA at $44,743, followed by the 50% retracement at $46,849 and then the 61.8% retracement at 51,109.
Bitcoin price is confronting a major technical challenge, suggesting that BTC investors should be prepared for a period of consolidation and reflection. Nevertheless, the impulsiveness of the move off the lows has positioned the cryptocurrency for bullish outcomes moving forward. It is now about patience and commitment as Bitcoin transitions from a rally to an advance.
Here, FXStreet's analysts evaluate where BTC could be heading next as it seems bound for a rebound before capitulation.


