
- Bitcoin price takes another jab at the 50% Fibonacci retracement at $35,618 in an attempt to tag the range high at $42,451.
- Ethereum price bounces off the lower end of a rising wedge pattern while the risk of downside looms.
- Ripple price bounces strongly off the midpoint of the range but slows down as it encounters an immediate resistance barrier.
Bitcoin price has been consolidating below the equilibrium of its trading range, revealing a lack of buying pressure. On the other hand, Ethereum, Ripple and other altcoins are taking this opportunity to rally.
Bitcoin price rallies prematurely
Bitcoin price retraced 6% after failing to slice through the 50% Fibonacci retracement level at $35,618. The retracement paused around $33,380 and continues to rally higher instead of sweeping the July 2 swing low at $32,700 or dipping into the demand zone extending from $30,573 to $31,979.
Therefore, investors can expect BTC might pull back once again at or before $35,619 and tag either of the two levels mentioned above.
The uptrend that originates as a result is likely to shatter the midpoint, aka equilibrium, at $35,619 and take a jab at the resistance levels ranging up to $40,516. A decisive 4-hour candlestick close above $40,516 will open the path to retest the range high at $42,452.
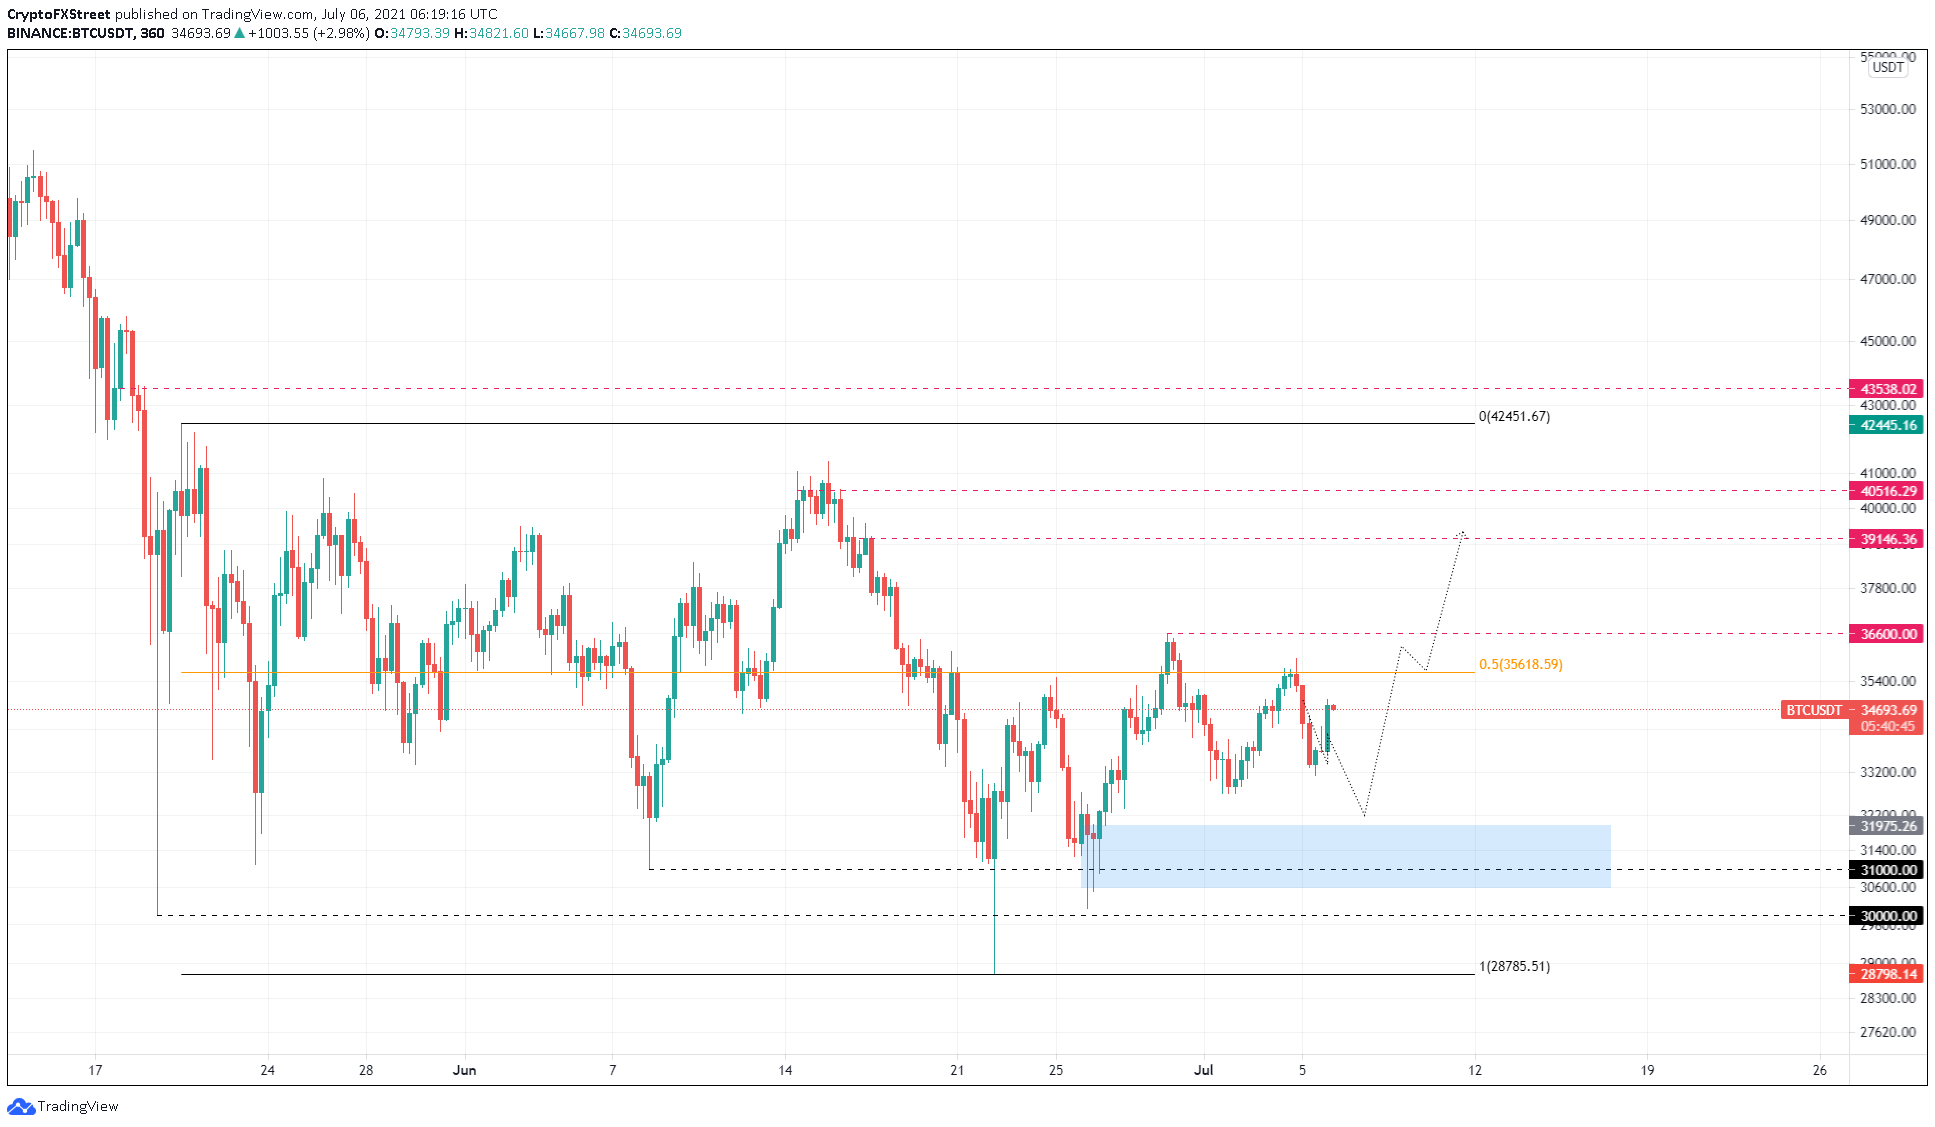
BTC/USDT 4-hour chart
On the other hand, a breakdown of the demand zone’s lower range at $30,573 will signal the non-existent buying pressure and invalidate the bullish outlook. In such a case, BTC might tag the support barrier at $30,000.
Ethereum price tries to defy bearish setup
Ethereum price has set up three higher highs and three lower lows since June 23. Connecting these swing points using trend lines reveals a rising wedge formation.
This technical pattern forecasts a 16% downswing to $1,909, determined by measuring the distance between the first swing high and low and adding it to the breakout point at $2,271.
However, the 16% crash could be cut short at the demand zone that ranges from $2,024 to $2,106. Therefore, investors can expect ETH to bounce from this area to shatter the midpoint of the range at $2,320.
If this were to happen, Ethereum price could further rally 25% to tag the range high at $2,912 after slicing through the intermediate barriers at $2,460 and $2,640.
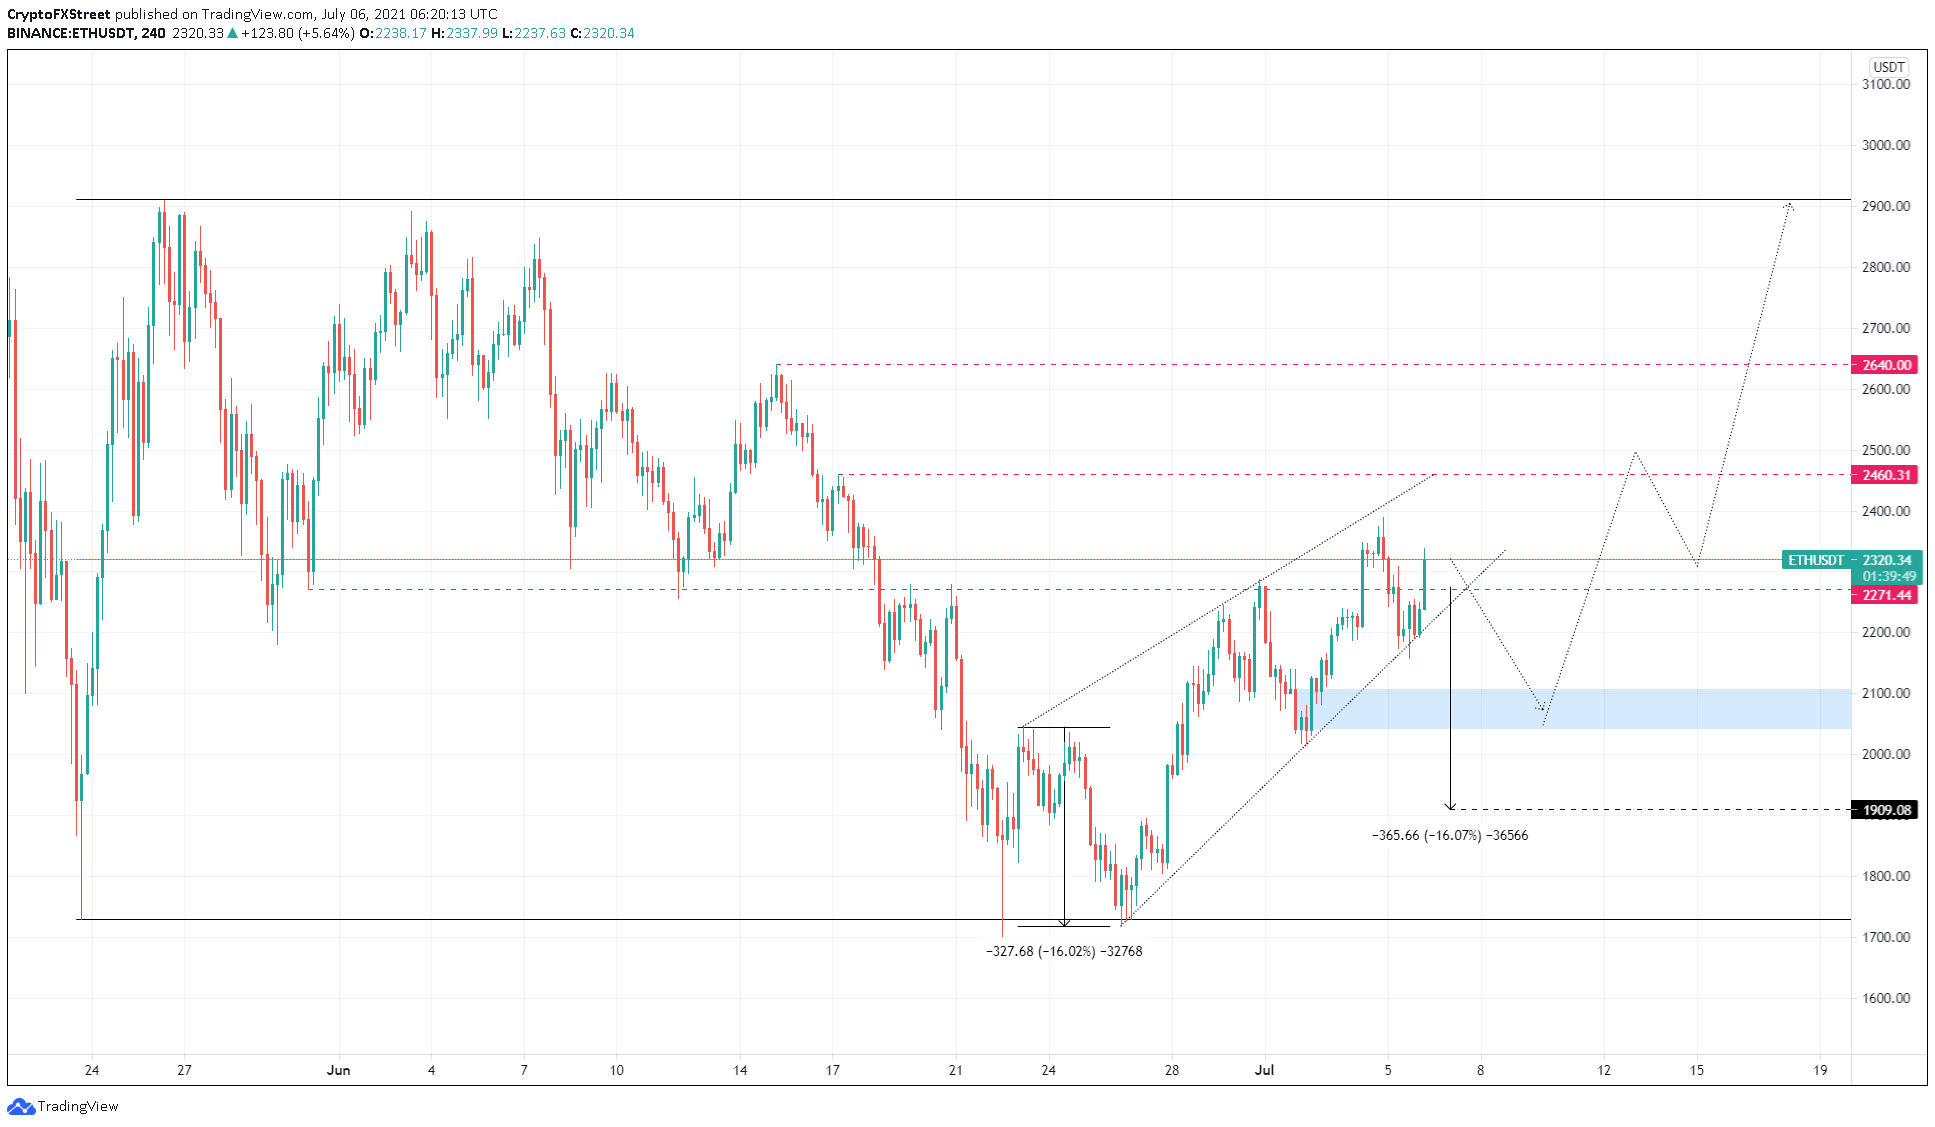
ETH/USDT 4-hour chart
If the selling pressure builds up enough to slice through the demand zone extending from $2,024 to $2,106, ETH will likely head to the intended target at $1,909.
In a highly bearish case, Ethereum price might end up sweeping the range low at $1,728. If the smart contract token fails to climb above $1,728, it will invalidate the bullish thesis.
Ripple price kick-starts the uptrend
Ripple price was awaiting a bounce from the 50% Fibonacci retracement level at $0.647, which came on July 5. The resulting upswing caught traction, surging 5% toward the 62% Fibonacci retracement level at $0.680.
The subsequent barriers include $0.704 and $0.727, representing the 70.5% and 79% Fibonacci retracement levels.
Breaching these barriers will open the path for the remittance token to retest the range high at $.785, roughly a 16% climb from its current position, $0.675.
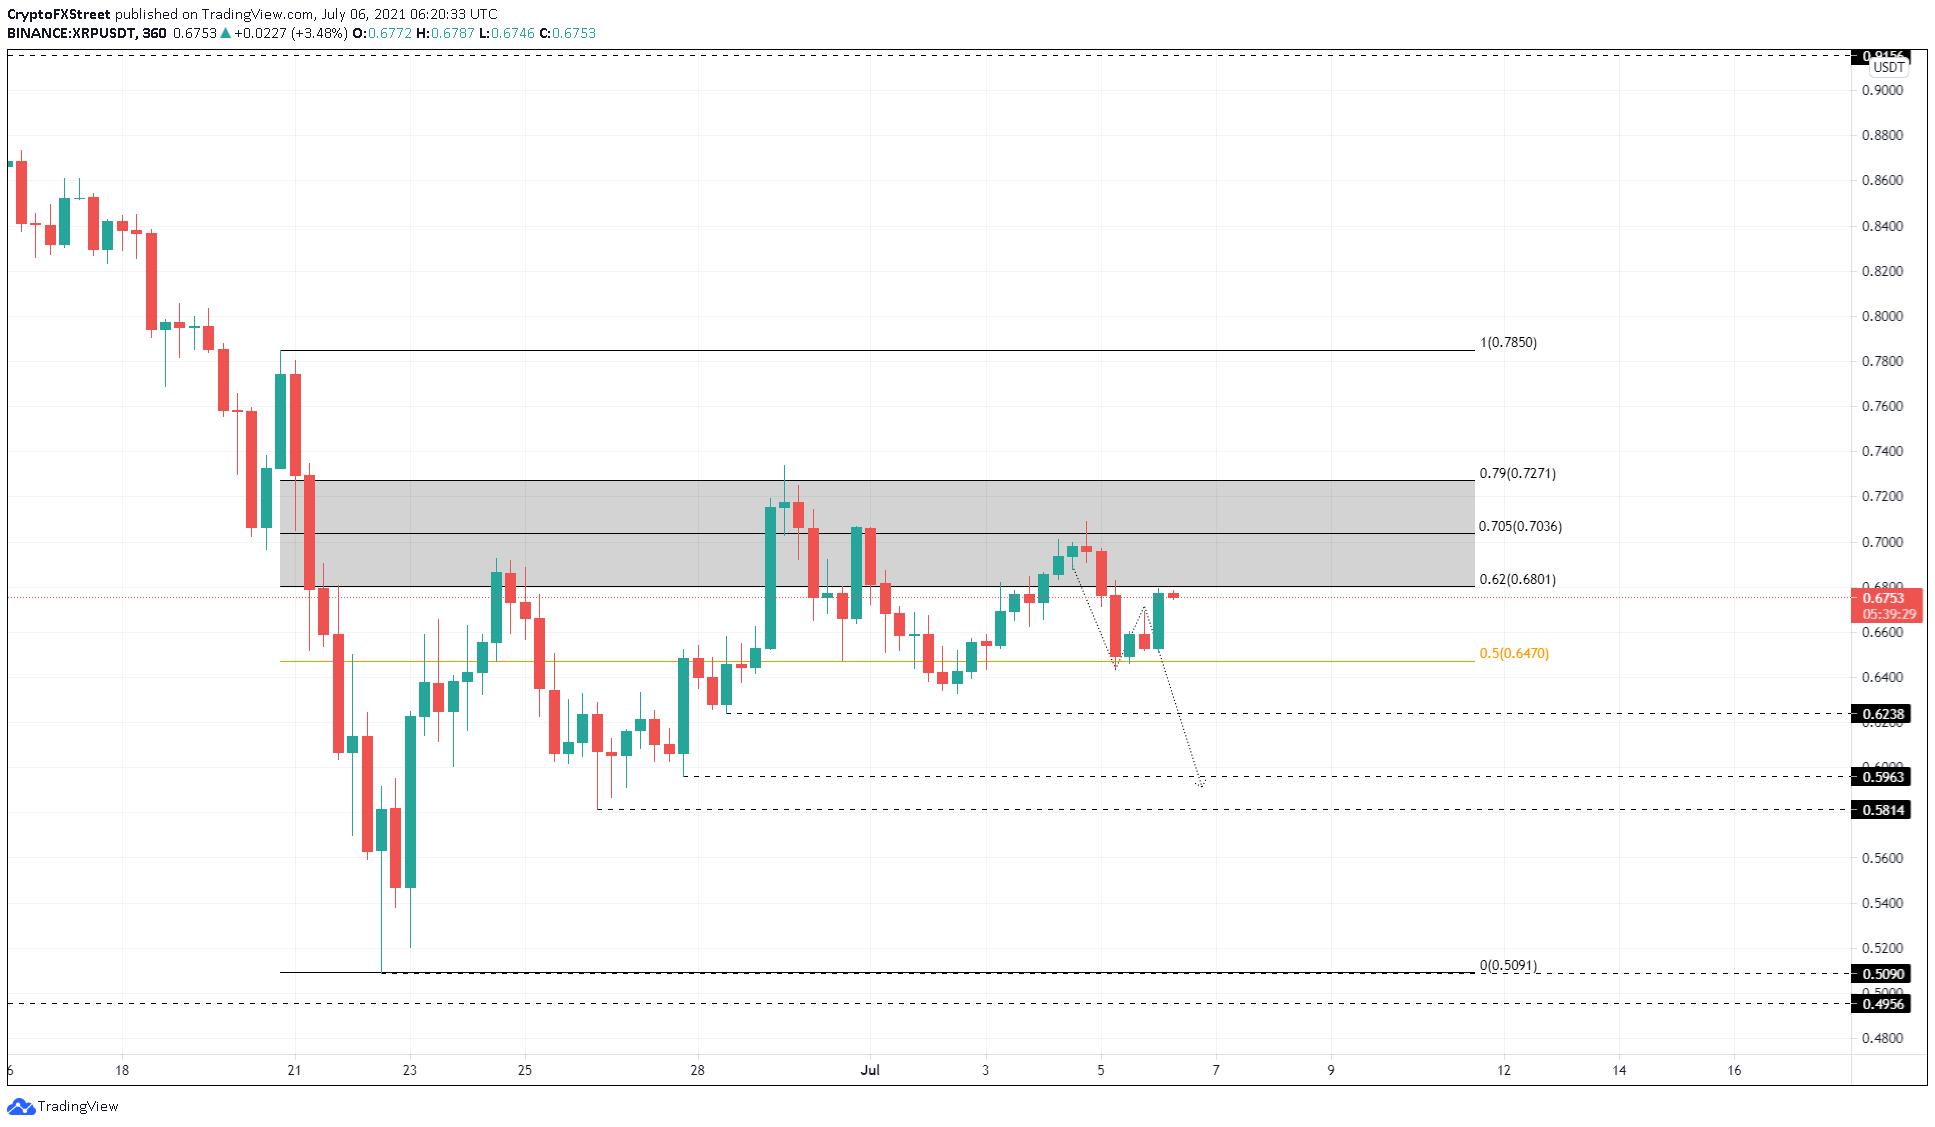
XRP/USDT 4-hour chart
However, a failure to climb past $0.647 or the subsequent barriers will indicate weak buying pressure and likely result in a downtrend toward the mid-point at $0.647 or the support level at $0.624.
A decisive close below $0.628 will invalidate the bullish thesis and trigger a 6% sell-off to $0.596 or $0.581.


