
- Bitcoin price building a symmetrical triangle with the apex emerging on June 10 if the contraction process continues.
- Ethereum price may close May with a long-legged doji pattern reflecting indecision among investors.
- XRP price reaches head-and-shoulders measured move target and quickly rebounds to $1.00.
Bitcoin price contraction in the form of a symmetrical triangle posits further volatility for the bellwether cryptocurrency in the near term. Ethereum price outlook remains unclear, but the emergence of an inverse head-and-shoulders pattern does clarify the short-term price structure. XRP price hammer breakout on the three-day chart remains live.
Argentina becoming the bitcoin mining capital of South America
The volatile economic history of Argentina has fueled a surge in cryptocurrency mining as companies and individuals seek a store of value. The low power rates and tighter capital controls are creating a windfall for miners in the football-crazed country. Consumer electricity equals 2% of the average income compared to two to three times in other South American countries.
Cryptocurrencies have a long history in Argentina, serving as a hedge against the economic roller coaster that has included sovereign defaults, hyperinflation and multiple currency devaluations. The tighter capital controls that have accompanied the ongoing recession have energized mining in the country, propelling the value of Bitcoin to almost 6.0 million pesos in the black market versus just 3.4 million pesos at the official rate.
In April, a Canadian mining firm, Bitfarms Ltd., negotiated a deal to patch directly into a local power plant with the plan of becoming the largest Bitcoin-mining facility in South America. The company sees a country with excess power generation due to the weak level of economic activity. It is a lucrative solution for power generators to sell their extra power and get paid in USD or Bitcoin, thereby sidestepping the foreign exchange controls.
Even if Bitcoin does suffer a new wave of selling, the low energy costs will continue to make mining a highly profitable business opportunity, stimulating further investment in the space by foreigners and small, local companies.
Bitcoin price demanding patience from investors as pattern evolves
Bitcoin price is definitely shaping a symmetrical triangle on the charts, with price now covering around 60% of the triangle. A symmetrical triangle is formed by two converging trend lines that come together on the right, forming the triangle’s apex. Volume tends to diminish as the triangle develops, and there is seldom any clue given on the chart containing the triangle if prices are going to break down or up. Investors need to wait until the asset finally decides to resolve the pattern. The pattern embodies hesitancy, or a “triangular area of doubt,” according to Robert D. Edwards and John Magee.
The BTC symmetrical triangle lies below the intersection of multiple levels of resistance that will challenge Bitcoin price for days and possibly weeks to come if the triangle resolves to the upside. The resistance includes the 38.2% Fibonacci retracement of the historic rally from the March 2020 low to the April high at $41,581, the January 8 high at $41,986, the February 28 low at $43,016 and 38.2% retracement level of the April-May decline at $43,331.
The measured move of the BTC triangle is approximately 30%, creating an upside target of $51,114 from the current position of the triangle’s upper trend line, which coincides closely with the 200 twelve-hour SMA at $52,605. To achieve a rally to the measured move target, Bitcoin price needs to overcome the sizeable resistance mentioned above and the 50 twelve-hour moving average at $44,522.
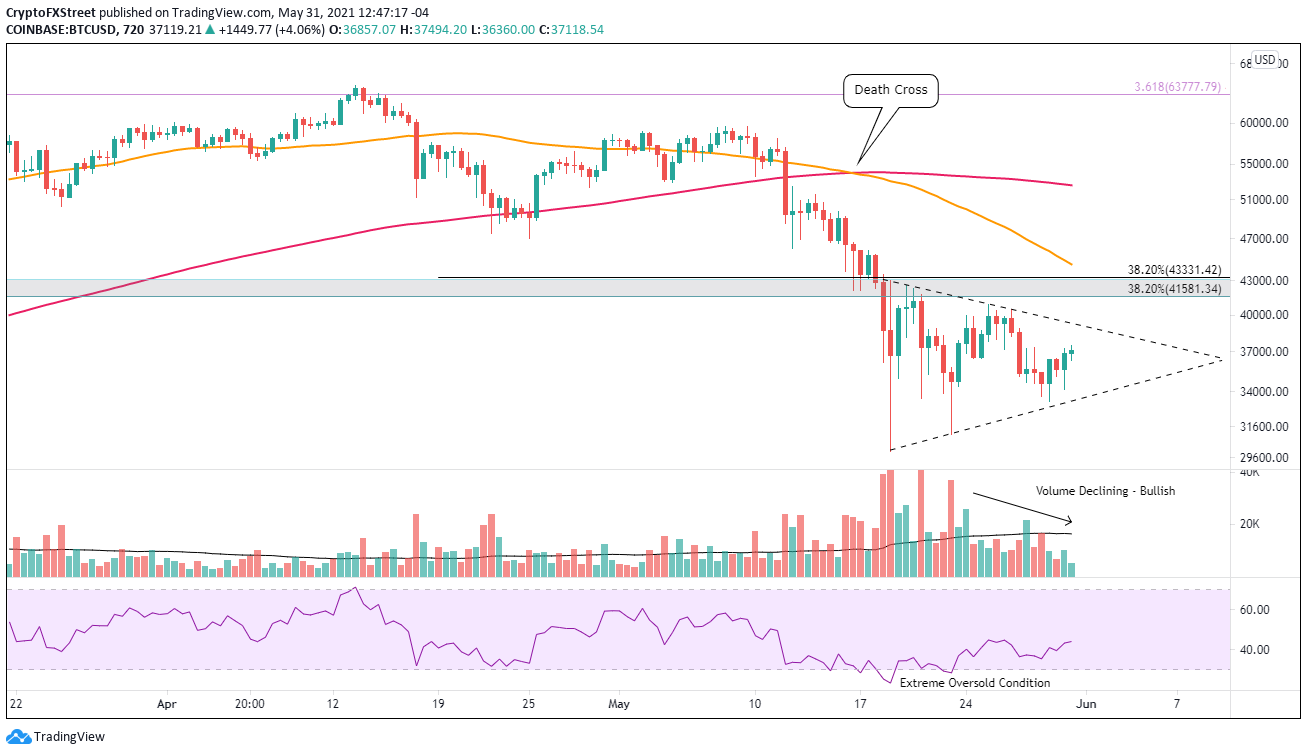
BTC/USD 12-hour chart
If the pattern resolves to the downside, the target is $23,369 from the current position of the triangle’s lower trend line. Bitcoin price would overwhelm the May 19 low at $30,000 and the 61.8% retracement of the advance beginning in March 2020 at $27,175.
It is essential to mention that the downside BTC target is just above the 2017 high at $19,891.
Ethereum price making a statement today
A bullish hammer candlestick on the 12-hour ETH chart initiated the rebound on May 23 after printing an oversold reading on the daily Relative Strength Index (RSI). It was accompanied by above-average volume. Moreover, the May 23 undercut of the May 19 low has established a double bottom pattern with a trigger price of $3,000.
Ethereum price is logging a double-digit gain at the time of writing, shedding the weakness of the preceding days. The smart contract giant emerged from a minor inverse head-and-shoulders pattern on the four-hour chart to initiate the jump. The measured move is 14% from the neckline. The target lifts ETH almost to the 50-day SMA, a resistance level from May 26 to May 27.
If the developing ETH rally from the inverse head-and-shoulders pattern gains traction above the 50-day SMA, it would be free to trigger the double bottom at $3,000, raising the odds for a test of the 61.8% retracement of the May correction at $3,369.
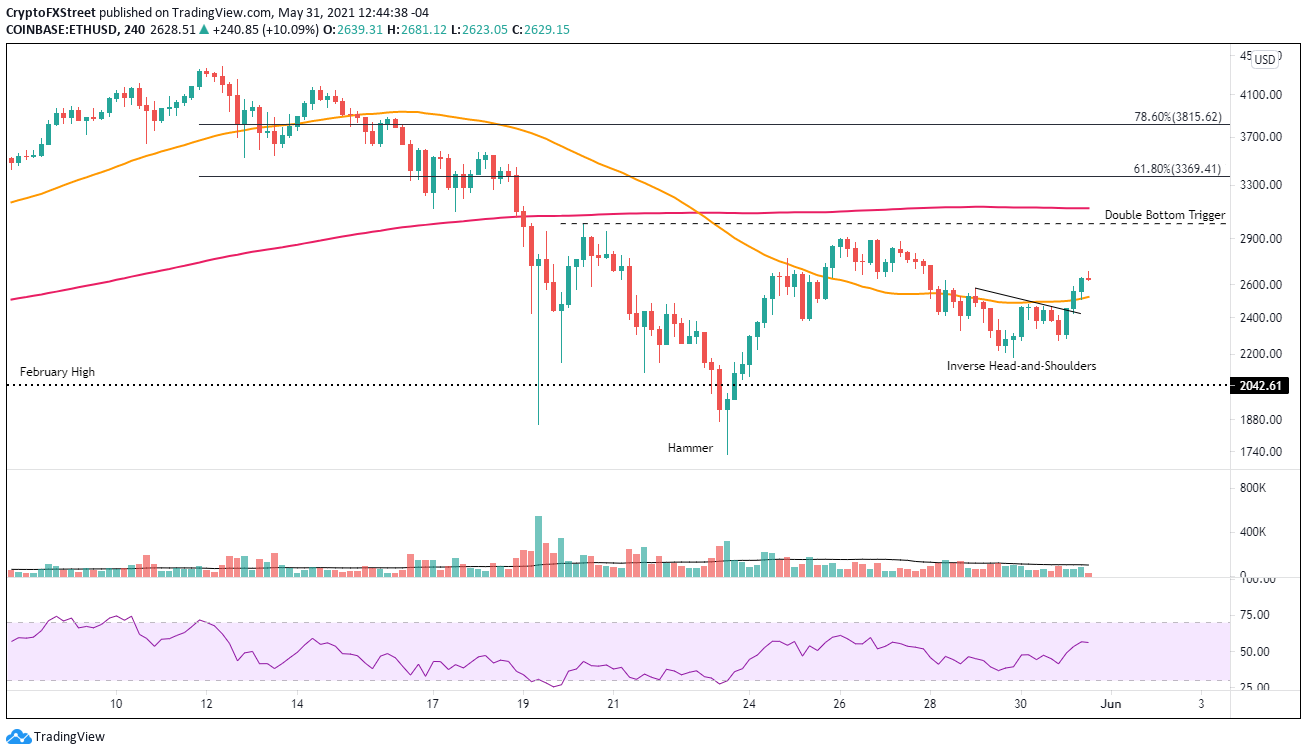
ETH/USD 4-hour chart
Ethereum price could lose the grip on the support framed by the 200 twelve-hour SMA at $2,324, risking a new test of the February high of $2,042. A daily close below the imposing level will downgrade the outlook to negative and raise the probability that ETH will sell down to the strategically important 200-day SMA at $1,657. Prominent investors and the growing number of institutions should be motivated to use the level to begin accumulating in size.
XRP price completes measured move
From May 24 to May 27, XRP price oscillated along the psychologically important $1.00 but could not overcome the declining 50 four-hour SMA. The Ripple price action during this time was passive with little volume, showing no real investor commitment. The result was a clear head-and-shoulders top.
On May 28, on a surge in volume, Ripple broke below the neckline at $0.968 and quickly fell to $0.846 before staging a minor rebound into the stubborn 50 four-hour SMA. XRP price did revert lower, beyond the head-and-shoulders measured move target of $0.818.
As of May 29, it looked like XRP price would continue the decline, but today’s double-digit rebound to $1.00 assures that the pattern is complete and Ripple is free to investigate higher prices.
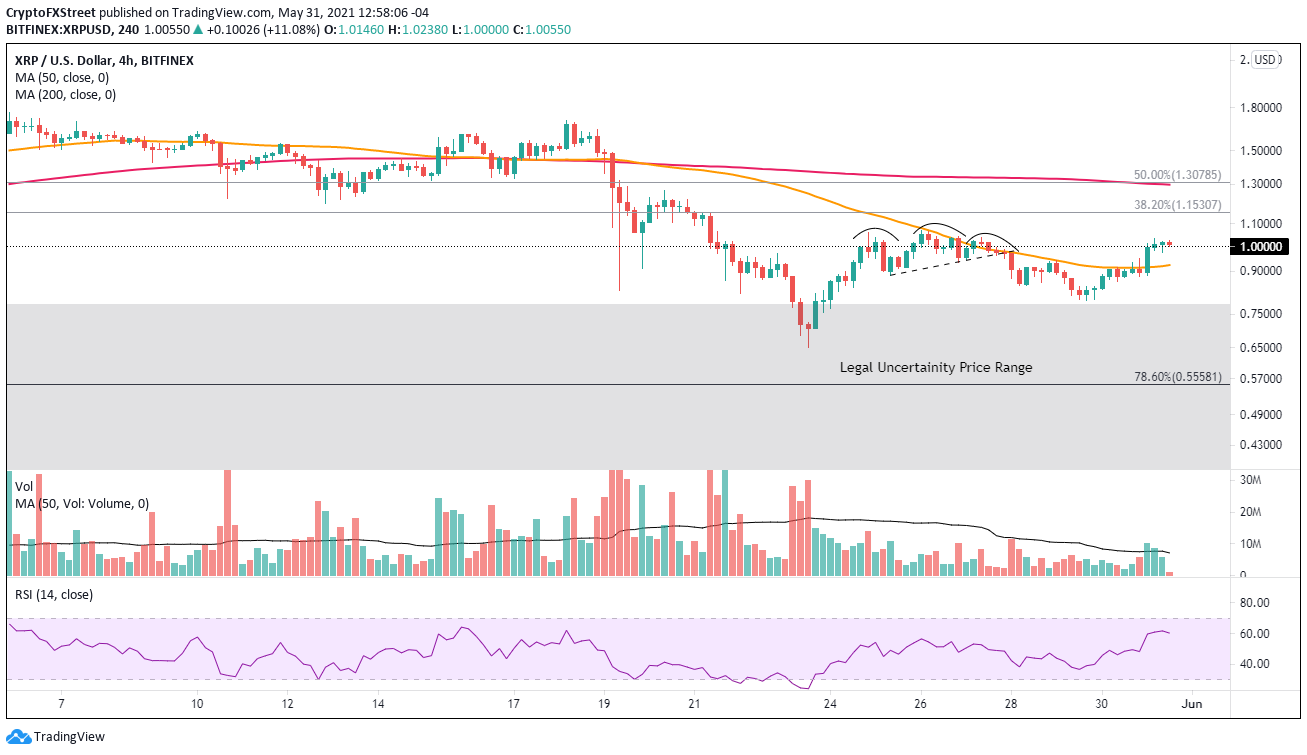
XRP/USD 4-hour chart
A new wave of selling in the crypto market could derail the rebound, forcing XRP price to test the upper level of the ‘legal uncertainty price range’ at $0.780 and possibly the February 21 high at $0.757. Any further weakness leaves Ripple vulnerable to plunge below the May 23 low at $0.652 and may even hit the 78.6% retracement of the rally from the December 29 low at $0.555.


